I previously blogged about ensuring that the “ON CONFLICT” directive is used in order to avoid vacuum from having to do additional work. I also later demonstrated the characteristics of how the use of the MERGE statement will accomplish the same thing.
Now in another recent customer case, I was chasing down why the application was invoking 10s of thousands of Foreign Key and Constraint violations per day and I began to wonder, if these kinds of errors also caused additional vacuum as described in those previous blogs. Sure enough it DEPENDS.
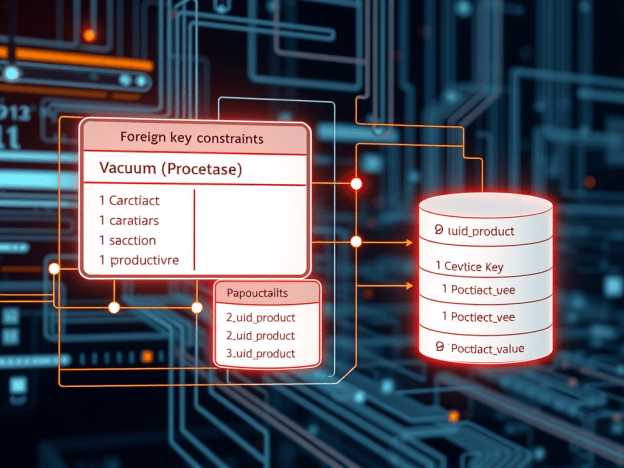
Let’s set up a quick test to demonstrate:
/* Create related tables: */
CREATE TABLE public.uuid_product_value (
        id int PRIMARY KEY,
        pkid text,
        value numeric,
        product_id int,
        effective_date timestamp(3)
        );

CREATE TABLE public.uuid_product (
        product_id int PRIMARY KEY
        );

ALTER TABLE uuid_product_value
    ADD CONSTRAINT uuid_product_value_product_id_fk
    FOREIGN KEY (product_id)
    REFERENCES uuid_product (product_id) ON DELETE CASCADE;

/* Insert some mocked up data */
INSERT INTO public.uuid_product VALUES (
        generate_series(0,200));

INSERT INTO public.uuid_product_value VALUES (
        generate_series(0,10000),
        gen_random_uuid()::text,
        random()*1000,
        ROUND(random()*100),
        current_timestamp(3));

/* Vacuum Analyze Both tables */
VACUUM (VERBOSE, ANALYZE) uuid_product;
VACUUM (VERBOSE, ANALYZE) uuid_product_value;

/* Verify that there are no dead tuples: */
SELECT
    schemaname,
    relname,
    n_live_tup,
    n_dead_tup
FROM
    pg_stat_all_tables
WHERE
    relname in ('uuid_product_value', 'uuid_product');

 schemaname |      relname       | n_live_tup | n_dead_tup
------------+--------------------+------------+------------
 public     | uuid_product_value |      10001 |          0
 public     | uuid_product       |        201 |          0
Then, let’s issue a simple insert that will violate the FK and check to see if dead tuples were generated:
/* Insert a row that violates the FK, without the ON CONFLICT directive */
INSERT INTO public.uuid_product_value VALUES (
        generate_series(10001,10001),
        gen_random_uuid()::text,
        random()*1000,
        202,  /* we know this product_id doesn't exist in the parent */
        current_timestamp(3));

ERROR:  insert or update on table "uuid_product_value" violates foreign key constraint "uuid_mod_test_product_id_fk"
DETAIL:  Key (product_id)=(202) is not present in table "uuid_product".
Time: 3.065 ms
And now check the tuple stats:
SELECT
    schemaname,
    relname,
    n_live_tup,
    n_dead_tup
FROM
    pg_stat_all_tables
WHERE
    relname in ('uuid_product_value', 'uuid_product');

 schemaname |      relname       | n_live_tup | n_dead_tup
------------+--------------------+------------+------------
 public     | uuid_product_value |      10001 |          1
 public     | uuid_product       |        201 |          0
Sure enough, we now have a dead row as a result of the FK violation on the insert. But, will an “ON CONFLICT” directive help us in this scenario like in the others?
/* Insert a row that violates the FK, but with the ON CONFLICT directive */
INSERT INTO public.uuid_product_value VALUES (
        generate_series(10001,10001),
        gen_random_uuid()::text,
        random()*1000,
        202,  /* we know this product_id doesn't exist in the parent */
        current_timestamp(3)) ON CONFLICT DO NOTHING;

/* Verify the tuple stats: */
SELECT
    schemaname,
    relname,
    n_live_tup,
    n_dead_tup
FROM
    pg_stat_all_tables
WHERE
    relname in ('uuid_product_value', 'uuid_product');

 schemaname |      relname       | n_live_tup | n_dead_tup
------------+--------------------+------------+------------
 public     | uuid_product_value |      10001 |          2
 public     | uuid_product       |        201 |          0
Unfortunately, it does not solve this problem. So we need to really be cognizant of FK violations and its effect on vacuum. Now what about trying to insert a NULL into a NOT NULL column? Will that result in a dead row? Let’s check.
/* Alter a column to NOT NULL */
ALTER TABLE public.uuid_product_value
    ALTER COLUMN pkid SET NOT NULL;

/* Check the table definition */
                        Table "public.uuid_product_value"
     Column     |              Type              | Collation | Nullable | Default
----------------+--------------------------------+-----------+----------+---------
 id             | integer                        |           | not null |
 pkid           | text                           |           | not null |
 value          | numeric                        |           |          |
 product_id     | integer                        |           |          |
 effective_date | timestamp(3) without time zone |           |          |
Indexes:
    "uuid_mod_test_pkey" PRIMARY KEY, btree (id)
    "uuid_mod_test_product_id_idx" btree (product_id) WHERE id >= 1 AND id <= 1000
    "uuid_mod_test_product_id_idx1" hash (product_id)
Foreign-key constraints:
    "uuid_mod_test_product_id_fk" FOREIGN KEY (product_id) REFERENCES uuid_product(product_id) ON DELETE CASCADE

/* Insert a row that violates the NOT NULL constraint */
INSERT INTO public.uuid_product_value VALUES (
        generate_series(10001,10001),
        NULL,
        random()*1000,
        200,
        current_timestamp(3));
ERROR:  null value in column "pkid" of relation "uuid_product_value" violates not-null constraint
DETAIL:  Failing row contains (10001, null, 613.162063338205, 200, 2026-03-13 14:25:28.758).

/* Verify the tuple stats: */
SELECT
    schemaname,
    relname,
    n_live_tup,
    n_dead_tup
FROM
    pg_stat_all_tables
WHERE
    relname in ('uuid_product_value', 'uuid_product');

 schemaname |      relname       | n_live_tup | n_dead_tup
------------+--------------------+------------+------------
 public     | uuid_product_value |      10001 |          2
 public     | uuid_product       |        201 |          0
As you can see, a violation of the NOT NULL constraint does not have the same behavior as a violation of the FK constraint. It’s always good to know and relay to the application development staff what operations are going to result in more work for the database and adjust the code accordingly. Enjoy!
The short answer is always “maybe”. However, in the following post, I hope to demonstrate what creates a sub-transactions and what happens to the overall transaction id utilization when they are invoked. I will also show how performance is affected when there are lots of connections creating and consuming sub-transactions.
First, it is important to understand what statements will utilize a transaction id and which ones may be more critical (expensive) than others:
Calling Nested Procedures: 🟢 Free. No new XIDs are used. They share the parent’s transaction.
BEGIN…END (No Exception Block): 🟢 Free. Just organization.
COMMIT: 🟡 Expensive. Burns a main Transaction ID (finite resource, leads to Vacuum Freeze).
EXCEPTION: 🔴 Dangerous. Creates a subtransaction (performance killer).
So why is misplaced EXCEPTION logic possibly a performance killer? PostgreSQL is optimized to handle a small number of open subtransactions very efficiently. Each backend process has a fixed-size array in shared memory (part of the PGPROC structure) that can hold up to 64 open subtransaction IDs (XIDs) for the current top-level transaction. As long as your nesting depth stays below 64, PostgreSQL manages everything in this fast, local memory array. It does not need to use the Subtrans SLRU (Simple Least Recently Used) subsystem, which is what pg_stat_slru tracks. The problem is that the utilization of subtransaction IDs (XIDs) can get out of hand rather quickly if you are not paying attention to your application flow and once PostgreSQL runs out of fast RAM slots (PGPROC array) and spills tracking data to the slow SLRU cache (pg_subtrans), performance degrades non-linearly (often 50x–100x slower) and causes global locking contention that can freeze other users.
One of the other byproducts of utilizing too many sub-transactions is the additional WAL that will be generated. All of these can be demonstrated by a simple block of code:
------------------------------------------------------------------
-- 1. PREP: Create the helper function
------------------------------------------------------------------
CREATE OR REPLACE FUNCTION generate_subtrans_load(p_id int, depth int)
RETURNS void AS $$
BEGIN
    IF depth > 0 THEN
        BEGIN
            PERFORM generate_subtrans_load(p_id, depth - 1);
        EXCEPTION WHEN OTHERS THEN NULL;
        END;
    ELSE
        INSERT INTO penalty_test VALUES (p_id, 'Deep Stack');
    END IF;
END;
$$ LANGUAGE plpgsql;

------------------------------------------------------------------
-- 2. THE COMPLETE TEST SUITE
------------------------------------------------------------------
DO $$
DECLARE
    -- Timing Variables
    v_start_ts  timestamp;
    v_t_base    interval; v_t_single interval;
    v_t_48      interval; v_t_128    interval;

    -- Row Verification
    v_rows_base int;      v_rows_single int;
    v_rows_48   int;      v_rows_128    int;

    -- WAL Variables
    v_start_lsn pg_lsn;   v_end_lsn  pg_lsn;
    v_wal_base  numeric;  v_wal_single numeric;
    v_wal_48    numeric;  v_wal_128    numeric;

    -- XID Variables
    v_start_xid xid8;     v_end_xid  xid8;
    v_xid_base  bigint;   v_xid_single bigint;
    v_xid_48    bigint;   v_xid_128    bigint;

    i int;
    v_target_rows int := 5000;

    -- Helper calc vars
    v_us_48 numeric;
    v_us_128 numeric;
BEGIN
    ---------------------------------------------------
    -- A. SETUP
    ---------------------------------------------------
    DROP TABLE IF EXISTS penalty_test;
    -- Explicitly preserve rows so COMMIT doesn't empty the table
    CREATE TEMP TABLE penalty_test (id int, val text) ON COMMIT PRESERVE ROWS;

    ---------------------------------------------------
    -- B. TEST 1: BASELINE (Standard Loop)
    ---------------------------------------------------
    -- 1. Force fresh start
    COMMIT;
    v_start_ts  := clock_timestamp();
    v_start_lsn := pg_current_wal_insert_lsn();
    v_start_xid := pg_snapshot_xmax(pg_current_snapshot());

    FOR i IN 1..v_target_rows LOOP
        INSERT INTO penalty_test VALUES (i, 'Standard');
    END LOOP;

    -- 2. Force snapshot refresh to see XID consumption
    COMMIT;
    v_end_lsn := pg_current_wal_insert_lsn();
    v_end_xid := pg_snapshot_xmax(pg_current_snapshot());
    v_t_base  := clock_timestamp() - v_start_ts;

    SELECT count(*) INTO v_rows_base FROM penalty_test;
    v_wal_base := v_end_lsn - v_start_lsn;
    v_xid_base := (v_end_xid::text::bigint - v_start_xid::text::bigint);

    ---------------------------------------------------
    -- C. TEST 2: SINGLE TRAP (Depth 1)
    ---------------------------------------------------
    TRUNCATE TABLE penalty_test;
    COMMIT; -- Clear stats

    v_start_ts  := clock_timestamp();
    v_start_lsn := pg_current_wal_insert_lsn();
    v_start_xid := pg_snapshot_xmax(pg_current_snapshot());

    FOR i IN 1..v_target_rows LOOP
        BEGIN
            INSERT INTO penalty_test VALUES (i, 'Single Trap');
        EXCEPTION WHEN OTHERS THEN NULL;
        END;
    END LOOP;

    COMMIT; -- Force refresh
    v_end_lsn := pg_current_wal_insert_lsn();
    v_end_xid := pg_snapshot_xmax(pg_current_snapshot());
    v_t_single := clock_timestamp() - v_start_ts;

    SELECT count(*) INTO v_rows_single FROM penalty_test;
    v_wal_single := v_end_lsn - v_start_lsn;
    v_xid_single := (v_end_xid::text::bigint - v_start_xid::text::bigint);

    ---------------------------------------------------
    -- D. TEST 3: SAFE ZONE (Depth 48)
    ---------------------------------------------------
    TRUNCATE TABLE penalty_test;
    COMMIT;

    v_start_ts  := clock_timestamp();
    v_start_lsn := pg_current_wal_insert_lsn();
    v_start_xid := pg_snapshot_xmax(pg_current_snapshot());

    FOR i IN 1..v_target_rows LOOP
        PERFORM generate_subtrans_load(i, 48);
    END LOOP;

    COMMIT;
    v_end_lsn := pg_current_wal_insert_lsn();
    v_end_xid := pg_snapshot_xmax(pg_current_snapshot());
    v_t_48    := clock_timestamp() - v_start_ts;

    SELECT count(*) INTO v_rows_48 FROM penalty_test;
    v_wal_48 := v_end_lsn - v_start_lsn;
    v_xid_48 := (v_end_xid::text::bigint - v_start_xid::text::bigint);

    ---------------------------------------------------
    -- E. TEST 4: OVERFLOW ZONE (Depth 128)
    ---------------------------------------------------
    TRUNCATE TABLE penalty_test;
    COMMIT;

    v_start_ts  := clock_timestamp();
    v_start_lsn := pg_current_wal_insert_lsn();
    v_start_xid := pg_snapshot_xmax(pg_current_snapshot());

    FOR i IN 1..v_target_rows LOOP
        PERFORM generate_subtrans_load(i, 128);
    END LOOP;

    COMMIT;
    v_end_lsn := pg_current_wal_insert_lsn();
    v_end_xid := pg_snapshot_xmax(pg_current_snapshot());
    v_t_128   := clock_timestamp() - v_start_ts;

    SELECT count(*) INTO v_rows_128 FROM penalty_test;
    v_wal_128 := v_end_lsn - v_start_lsn;
    v_xid_128 := (v_end_xid::text::bigint - v_start_xid::text::bigint);

    ---------------------------------------------------
    -- F. THE REPORT
    ---------------------------------------------------
    RAISE NOTICE '===================================================';
    RAISE NOTICE '    POSTGRESQL SUBTRANSACTION IMPACT REPORT      ';
    RAISE NOTICE '===================================================';
    RAISE NOTICE 'Target Rows: %', v_target_rows;
    RAISE NOTICE '---------------------------------------------------';

    RAISE NOTICE 'METRIC 1: EXECUTION TIME & VERIFICATION';
    RAISE NOTICE '  1. Baseline:         % (Rows: %)', v_t_base, v_rows_base;
    RAISE NOTICE '  2. Single Exception: % (Rows: %)', v_t_single, v_rows_single;
    RAISE NOTICE '  3. Safe Zone (48):   % (Rows: %)', v_t_48, v_rows_48;
    RAISE NOTICE '  4. Overflow (128):   % (Rows: %)', v_t_128, v_rows_128;
    RAISE NOTICE '---------------------------------------------------';

    v_us_48  := extract(epoch from v_t_48) * 1000000;
    v_us_128 := extract(epoch from v_t_128) * 1000000;

    RAISE NOTICE 'METRIC 2: AVERAGE COST PER SUBTRANSACTION';
    RAISE NOTICE '   - Safe Zone (48):     % us per subtrans', round(v_us_48 / (v_target_rows * 48), 2);
    RAISE NOTICE '   - Overflow Zone (128): % us per subtrans', round(v_us_128 / (v_target_rows * 128), 2);

    IF (v_us_128 / (v_target_rows * 128)) > (v_us_48 / (v_target_rows * 48)) THEN
        RAISE NOTICE '   -> RESULT: Overflow subtransactions were % %% slower per unit.',
            round( ( ((v_us_128 / (v_target_rows * 128)) - (v_us_48 / (v_target_rows * 48))) / (v_us_48 / (v_target_rows * 48)) * 100)::numeric, 1);
    ELSE
         RAISE NOTICE '   -> RESULT: Overhead appears linear.';
    END IF;
    RAISE NOTICE '---------------------------------------------------';

    RAISE NOTICE 'METRIC 3: DISK USAGE (WAL WRITTEN)';
    RAISE NOTICE '  1. Baseline:         % bytes', v_wal_base;
    RAISE NOTICE '  2. Single Exception: % bytes', v_wal_single;
    RAISE NOTICE '  3. Safe Zone (48):   % bytes', v_wal_48;
    RAISE NOTICE '  4. Overflow (128):   % bytes', v_wal_128;
    RAISE NOTICE '---------------------------------------------------';

    RAISE NOTICE 'METRIC 4: TRANSACTION ID CONSUMPTION';
    RAISE NOTICE '  1. Baseline:         % XIDs', v_xid_base;
    RAISE NOTICE '  2. Single Exception: % XIDs', v_xid_single;
    RAISE NOTICE '  3. Safe Zone (48):   % XIDs', v_xid_48;
    RAISE NOTICE '  4. Overflow (128):   % XIDs', v_xid_128;

    RAISE NOTICE '===================================================';
END $$;
The code block above shows 4 different scenarios:
Baseline: Simple insert that inserts a number of rows in a loop with no exception logic
Single Exception (Depth 1): The same insert loop but with an exception block that fires after every insert
48 Sub-transaction Loop (Depth 48): A function call that arbitrarily creates 48 subtransactions (well below the 64 limit) and then completes the same insert
128 Sub-transaction Loop (Depth 128): A function call that arbitrarily creates 128 subtransactions (well above the 64 limit) and then completes the same insert
What you will see is that when run by a single user the impact is not terribly great. Besides utilizing more transaction ids (XIDs) and generating much wal, the system and performance impact of this does not appear to be a big deal. When running for a 5000 row insert:
NOTICE:  ===================================================
NOTICE:      POSTGRESQL SUBTRANSACTION IMPACT REPORT
NOTICE:  ===================================================
NOTICE:  Target Rows: 5000
NOTICE:  ---------------------------------------------------
NOTICE:  METRIC 1: EXECUTION TIME & VERIFICATION
NOTICE:    1. Baseline:         00:00:00.020292 (Rows: 5000)
NOTICE:    2. Single Exception: 00:00:00.033419 (Rows: 5000)
NOTICE:    3. Safe Zone (48):   00:00:01.414132 (Rows: 5000)
NOTICE:    4. Overflow (128):   00:00:03.817267 (Rows: 5000)
NOTICE:  ---------------------------------------------------
NOTICE:  METRIC 2: AVERAGE COST PER SUBTRANSACTION
NOTICE:     - Safe Zone (48):     5.89 us per subtrans
NOTICE:     - Overflow Zone (128): 5.96 us per subtrans
NOTICE:     -> RESULT: Overflow subtransactions were 1.2 % slower per unit.
NOTICE:  ---------------------------------------------------
NOTICE:  METRIC 3: DISK USAGE (WAL WRITTEN)
NOTICE:    1. Baseline:         48 bytes
NOTICE:    2. Single Exception: 43936 bytes
NOTICE:    3. Safe Zone (48):   2076216 bytes
NOTICE:    4. Overflow (128):   5536832 bytes
NOTICE:  ---------------------------------------------------
NOTICE:  METRIC 4: TRANSACTION ID CONSUMPTION
NOTICE:    1. Baseline:         1 XIDs
NOTICE:    2. Single Exception: 5001 XIDs
NOTICE:    3. Safe Zone (48):   240001 XIDs
NOTICE:    4. Overflow (128):   640002 XIDs
NOTICE:  ===================================================
DO
Time: 5294.689 ms (00:05.295)
As you can see in the results above, due to the transaction tracking, each scenario burns more XIDs and creates more WAL. This is due to the additional transaction tracking that must be available should the WAL need to be replayed. Where the real killer comes in is when multiple connections all begin to execute this same code. When I did a synthetic test using Apache JMeter the results are astounding. The test was completed on a 4vCPU C4A AlloyDB Instance:
Test
Average Time Per Exec
Min Exec Time
Max EXEC Time
1 User x 50 iterations
2137ms
2069ms
3477ms
4 Users x 50 iterations
3171ms
2376ms
4080ms
10 Users x 50 iterations
9041ms
4018ms
47880ms
As more users are added, the time is increased due to the time needed to manage the XID space and write the additional WAL. Some of this is increased time is due to the elongated connection time due to the XID space. When the same test was executed with a Managed Connection Pooler, times came down a little bit:
Test
Average Time Per Exec
Min Exec Time
Max EXEC Time
10 Users x 50 iterations
6399ms
2690ms
10624ms
Now you ask, how can I monitor for this performance impact? The verdict is that it depends. Wide variations in execution time depending on database load may be one indication. Another indication may be entries in the pg_stat_slru table (however depending on the available ram, metrics may not appear here) and a final indication will always be WAL usage. In summary:
Metric
What it tells you
What it hides
Execution Time
“My query is slow.”
It doesn’t explain why (CPU vs Lock vs I/O). Additional investigation may be required.
pg_stat_slru
“Disk is thrashing.”
It reads 0 if you have enough RAM, hiding the fact that your CPU is burning up managing memory locks.
WAL Volume
The Real Truth.
It proves you are writing massive amounts of metadata (savepoint markers) to disk, even if the data volume is small.
When considering the three scenarios:
Tier 1: Standard Loop (Baseline)
Mechanism: One single transaction for the whole batch.
Overhead: Near zero.
Verdict: 🟢 Safe. This is how Postgres is designed to work.
Tier 2: The “Safety Trap” (Exception Block)
Mechanism: Uses BEGIN…EXCEPTION inside the loop.
Hidden Cost: Every single iteration creates a Subtransaction. This burns a Subtransaction ID and forces a WAL write to create a “savepoint” it can roll back to.
Verdict: 🟡 Risky. It is 3x–5x slower and generates massive Write-Ahead Log (WAL) bloat, even for successful inserts.
Tier 3: The “Overflow” Disaster (Depth > 64)
Mechanism: Nesting subtransactions deeper than 64 layers (or having >64 active savepoints).
The Cliff: PostgreSQL runs out of fast RAM slots (PGPROC array) and must spill tracking data to the slow SLRU cache (pg_subtrans).
Verdict: 🔴 Catastrophic. Performance degrades non-linearly (often 50x–100x slower) and causes global locking contention that can freeze other users.
Final Recommendation: If you need to handle errors in a bulk load (e.g., “Insert 10,000 rows, skip the ones that fail”):
DO validate data before the insert to filter out bad rows in the application layer or a staging table
Do NOT wrap every insert in an EXCEPTION block. i.e a LOOP
Use EXCEPTION logic purposefully and avoid the need for CATCH ALL like “WHEN OTHERS”
DO use INSERT … ON CONFLICT DO NOTHING (if the error is unique constraint)
By default, the PostgreSQL JDBC driver fetches all rows at once and attempts to load them into memory vs. other drivers such as Oracle that by default only fetches 10 rows at a time. Both defaults have pros and cons, however in the context of the types of workloads I see every day, the PostgreSQL default is typically not optimal.
As a frame of reference, the default PostgreSQL fetch size is just fine if you have queries that always return small result sets. If there is a chance that larger results sets could be retrieved, a high variance of performance between small and large result sets will be seen and an explicit fetch size should be considered.
To demonstrate, I wanted to create a demo application which would create a simulated table with 2 million rows and select them with various fetch sizes:
fetchSize of 1000 (stream 1000 rows at a time)
fetchSize of 5000 (stream 5000 rows at a time)
fetchSize of 0 (fetch all rows at once) – Default
For a query returning 2 million rows, leveraging the default fetch size produce the following results:
java -cp .:/home/shaneborden_google_com/java/postgresql-42.5.4.jar DatabaseFetchSizeTest

--- Database Setup ---
  [MEMORY] Initial Baseline: 6.68 MB Used (Total Heap: 56.00 MB)
Existing table dropped.
New table created: large_data_test
Inserting 2000000 rows... Done in 44.36 seconds.
  [MEMORY] After Data Insertion: 6.72 MB Used (Total Heap: 40.00 MB)

------------------------------------------------------------
--- Running Test: Small Chunk (1000 rows) (Fetch Size: 1000) ---
------------------------------------------------------------
Executing query with fetch size 1000...
  [MEMORY] 1. Before Query Execution: 6.63 MB Used (Total Heap: 40.00 MB)
  [MEMORY] 2. After Query Execution (Data Loaded/Cursor Open): 6.86 MB Used (Total Heap: 40.00 MB)
Test Complete.
  Total Rows Read: 2000000
  Total Time Taken: 1613 ms
  [MEMORY] 3. After All Rows Processed: 6.67 MB Used (Total Heap: 68.00 MB)
  Mode: STREAMING. Expect memory usage to remain low and flat across stages 1-3.

------------------------------------------------------------
--- Running Test: Optimal Chunk (5000 rows) (Fetch Size: 5000) ---
------------------------------------------------------------
Executing query with fetch size 5000...
  [MEMORY] 1. Before Query Execution: 6.67 MB Used (Total Heap: 40.00 MB)
  [MEMORY] 2. After Query Execution (Data Loaded/Cursor Open): 7.76 MB Used (Total Heap: 40.00 MB)
Test Complete.
  Total Rows Read: 2000000
  Total Time Taken: 1104 ms
  [MEMORY] 3. After All Rows Processed: 6.67 MB Used (Total Heap: 56.00 MB)
  Mode: STREAMING. Expect memory usage to remain low and flat across stages 1-3.

------------------------------------------------------------
--- Running Test: Default (0 - all at once) (Fetch Size: 0) ---
------------------------------------------------------------
Executing query with fetch size 0...
  [MEMORY] 1. Before Query Execution: 6.67 MB Used (Total Heap: 40.00 MB)
  [MEMORY] 2. After Query Execution (Data Loaded/Cursor Open): 454.03 MB Used (Total Heap: 780.00 MB)
Test Complete.
  Total Rows Read: 2000000
  Total Time Taken: 1480 ms
  [MEMORY] 3. After All Rows Processed: 454.03 MB Used (Total Heap: 1560.00 MB)
  Mode: ALL-AT-ONCE. Expect a large memory spike at stage 2.
fetchSize of 1000 (stream 1000 rows at a time) – Total Time: 1613ms
fetchSize of 5000 (stream 5000 rows at a time) – Total Time: 1104ms
fetchSize of 0 (fetch all rows at once) – Total Time: 1480ms
So in the above example, just setting the fetch size down from unlimited to 5000 yielded a performance improvement of just over 25%!
If you had a mixture of result set sizes, this second test shows the result of the fetch size setting when smaller result sets are expected. As demonstrated with a 2000 row test, the variance is still exists, but not as dramatic so setting the fetch size at 5000 for most queries would be acceptable:
java -cp .:/home/shaneborden_google_com/java/postgresql-42.5.4.jar DatabaseFetchSizeTest

--- Database Setup ---
  [MEMORY] Initial Baseline: 6.68 MB Used (Total Heap: 68.00 MB)
Existing table dropped.
New table created: large_data_test
Inserting 2000 rows... Done in 0.15 seconds.
  [MEMORY] After Data Insertion: 6.60 MB Used (Total Heap: 40.00 MB)

------------------------------------------------------------
--- Running Test: Small Chunk (1000 rows) (Fetch Size: 1000) ---
------------------------------------------------------------
Executing query with fetch size 1000...
  [MEMORY] 1. Before Query Execution: 6.60 MB Used (Total Heap: 40.00 MB)
  [MEMORY] 2. After Query Execution (Data Loaded/Cursor Open): 6.83 MB Used (Total Heap: 40.00 MB)
Test Complete.
  Total Rows Read: 2000
  Total Time Taken: 41 ms
  [MEMORY] 3. After All Rows Processed: 6.63 MB Used (Total Heap: 40.00 MB)
  Mode: STREAMING. Expect memory usage to remain low and flat across stages 1-3.

------------------------------------------------------------
--- Running Test: Optimal Chunk (5000 rows) (Fetch Size: 5000) ---
------------------------------------------------------------
Executing query with fetch size 5000...
  [MEMORY] 1. Before Query Execution: 6.63 MB Used (Total Heap: 40.00 MB)
  [MEMORY] 2. After Query Execution (Data Loaded/Cursor Open): 7.07 MB Used (Total Heap: 40.00 MB)
Test Complete.
  Total Rows Read: 2000
  Total Time Taken: 28 ms
  [MEMORY] 3. After All Rows Processed: 7.07 MB Used (Total Heap: 40.00 MB)
  Mode: STREAMING. Expect memory usage to remain low and flat across stages 1-3.

------------------------------------------------------------
--- Running Test: Default (0 - all at once) (Fetch Size: 0) ---
------------------------------------------------------------
Executing query with fetch size 0...
  [MEMORY] 1. Before Query Execution: 6.63 MB Used (Total Heap: 40.00 MB)
  [MEMORY] 2. After Query Execution (Data Loaded/Cursor Open): 7.07 MB Used (Total Heap: 40.00 MB)
Test Complete.
  Total Rows Read: 2000
  Total Time Taken: 36 ms
  [MEMORY] 3. After All Rows Processed: 7.08 MB Used (Total Heap: 40.00 MB)
  Mode: ALL-AT-ONCE. Expect a large memory spike at stage 2.
fetchSize of 1000 (stream 1000 rows at a time) – Total Time: 41ms
fetchSize of 5000 (stream 5000 rows at a time) – Total Time: 28ms
fetchSize of 0 (fetch all rows at once) – Total Time: 36ms
So in the above example, using a fetch size of 5000 even for smaller result sets still yielded a 22% improvement!
One thing to keep in mind is that depending on the width of your row, the fetch size may need to be tuned yet again. A network packet is only so large and in cases of very wide rows, a smaller fetch size may be more beneficial.
Check out changing the fetchSize with your application!
Code Appendix
DatabaseFetchSizeTest.java
DatabaseFetchSizeTest.java
import java.sql.Connection;
import java.sql.DriverManager;
import java.sql.PreparedStatement;
import java.sql.ResultSet;
import java.sql.SQLException;
import java.sql.Statement;
import java.util.Properties;

/**
 * A Java application to demonstrate the effect of the JDBC fetchSize parameter
 * on query performance when retrieving a large result set from PostgreSQL.
 *
 * The PostgreSQL JDBC driver, by default, fetches all rows at once. By setting
 * a non-zero fetchSize, we enable cursor mode on the server, allowing the driver
 * to retrieve results in chunks, which is crucial for handling large datasets
 * without running out of memory on the client side.
 */
public class DatabaseFetchSizeTest {

    // --- CONFIGURATION ---
    private static final String DB_URL = "jdbc:postgresql://10.3.1.17:5432/postgres"; // Change 'your_database'
    private static final String DB_USER = "postgres";     // Change this
    private static final String DB_PASSWORD = "Google54321"; // Change this

    private static final String TABLE_NAME = "large_data_test";
    private static final int NUM_ROWS_TO_INSERT = 2000;
    private static final int SMALL_FETCH_SIZE = 1000; // Small size for initial run
    private static final int OPTIMAL_FETCH_SIZE = 5000; // A reasonable chunk size
    private static final int DEFAULT_FETCH_SIZE = 0; // PostgreSQL default (fetches all rows at once)

    public static void main(String[] args) {
        // Ensure the PostgreSQL driver is loaded
        try {
            Class.forName("org.postgresql.Driver");
        } catch (ClassNotFoundException e) {
            System.err.println("PostgreSQL JDBC Driver not found. Please ensure the JAR is in your classpath.");
            return;
        }

        // 1. Setup Environment
        try (Connection conn = getConnection()) {
            setupDatabase(conn);

            // 2. Run Tests
            // Running the 'default' last usually gives the best contrast in memory usage.
            runTest(conn, SMALL_FETCH_SIZE, "Small Chunk (1000 rows)");
            runTest(conn, OPTIMAL_FETCH_SIZE, "Optimal Chunk (5000 rows)");
            runTest(conn, DEFAULT_FETCH_SIZE, "Default (0 - all at once)");


        } catch (SQLException e) {
            System.err.println("Database error occurred: " + e.getMessage());
            e.printStackTrace();
        }
    }

    /**
     * Establishes a connection and sets auto-commit to false to allow streaming.
     */
    private static Connection getConnection() throws SQLException {
        Properties props = new Properties();
        props.setProperty("user", DB_USER);
        props.setProperty("password", DB_PASSWORD);
        // Important: Set the auto-commit to false to enable server-side cursors (streaming)
        Connection conn = DriverManager.getConnection(DB_URL, props);
        conn.setAutoCommit(false);
        return conn;
    }

    /**
     * Creates the test table and populates it with a large number of rows.
     */
    private static void setupDatabase(Connection conn) throws SQLException {
        System.out.println("--- Database Setup ---");
        displayMemory("Initial Baseline");

        try (Statement stmt = conn.createStatement()) {
            // Drop table if it exists
            stmt.executeUpdate("DROP TABLE IF EXISTS " + TABLE_NAME);
            System.out.println("Existing table dropped.");

            // Create new table
            stmt.executeUpdate("CREATE TABLE " + TABLE_NAME + " (id SERIAL PRIMARY KEY, data_value TEXT, timestamp TIMESTAMP)");
            System.out.println("New table created: " + TABLE_NAME);
        }

        // Insert a large number of rows
        String insertSQL = "INSERT INTO " + TABLE_NAME + " (data_value, timestamp) VALUES (?, NOW())";
        try (PreparedStatement pstmt = conn.prepareStatement(insertSQL)) {
            System.out.print("Inserting " + NUM_ROWS_TO_INSERT + " rows...");
            long startTime = System.currentTimeMillis();

            for (int i = 1; i <= NUM_ROWS_TO_INSERT; i++) {
                // Each row has a string of decent length
                pstmt.setString(1, "Data record number " + i + " - Padding to increase row size for better memory test.");
                pstmt.addBatch();
                if (i % 10000 == 0) { // Execute batch every 10,000 rows
                    pstmt.executeBatch();
                    conn.commit();
                }
            }
            pstmt.executeBatch();
            conn.commit();
            long endTime = System.currentTimeMillis();
            System.out.printf(" Done in %.2f seconds.\n", (endTime - startTime) / 1000.0);
        }
        displayMemory("After Data Insertion");
    }

    /**
     * Helper method to calculate and display current used heap memory.
     * @param stage A string label describing the point of measurement.
     */
    private static void displayMemory(String stage) {
        // Request garbage collection hint to get a cleaner reading
        System.gc();
        long totalMemory = Runtime.getRuntime().totalMemory();
        long freeMemory = Runtime.getRuntime().freeMemory();
        long usedMemory = totalMemory - freeMemory;
        double usedMB = usedMemory / (1024.0 * 1024.0);
        double totalMB = totalMemory / (1024.0 * 1024.0);

        System.out.printf("  [MEMORY] %s: %.2f MB Used (Total Heap: %.2f MB)\n",
                stage, usedMB, totalMB);
    }

    /**
     * Runs the query test with a specified fetch size and measures performance and memory.
     * @param conn The database connection.
     * @param fetchSize The JDBC fetch size to use.
     * @param label A description for the test.
     */
    private static void runTest(Connection conn, int fetchSize, String label) {
        System.out.println("\n------------------------------------------------------------");
        System.out.println("--- Running Test: " + label + " (Fetch Size: " + fetchSize + ") ---");
        System.out.println("------------------------------------------------------------");

        String querySQL = "SELECT id, data_value, timestamp FROM " + TABLE_NAME;
        long rowsRead = 0;

        try (Statement stmt = conn.createStatement()) {
            // Set the crucial parameter
            stmt.setFetchSize(fetchSize);
            System.out.println("Executing query with fetch size " + fetchSize + "...");

            displayMemory("1. Before Query Execution");
            long startTime = System.currentTimeMillis();

            try (ResultSet rs = stmt.executeQuery(querySQL)) {

                // CRITICAL MEMORY MEASUREMENT POINT:
                // For fetchSize=0, the entire result set is in memory here.
                displayMemory("2. After Query Execution (Data Loaded/Cursor Open)");

                // Process the result set (simulating application logic)
                while (rs.next()) {
                    rowsRead++;
                    // Read data to ensure all data is pulled from the driver/server
                    rs.getString("data_value");
                }

                long endTime = System.currentTimeMillis();
                long duration = endTime - startTime;

                System.out.println("Test Complete.");
                System.out.println("  Total Rows Read: " + rowsRead);
                System.out.printf("  Total Time Taken: %d ms\n", duration);

                displayMemory("3. After All Rows Processed");

                // Analyze the difference
                if (fetchSize == 0) {
                    System.out.println("  Mode: ALL-AT-ONCE. Expect a large memory spike at stage 2.");
                } else {
                    System.out.println("  Mode: STREAMING. Expect memory usage to remain low and flat across stages 1-3.");
                }
            }

        } catch (SQLException e) {
            System.err.println("Error during test run: " + e.getMessage());
            System.err.println("HINT: Ensure autoCommit is set to FALSE on the connection for fetchSize > 0 to work.");
        }
    }
}
Compile and Execute
PostgreSQL JDBC Fetch Size and Memory Test
This application is designed to demonstrate how the JDBC fetchSize parameter affects not only query time but also the client-side heap memory usage. It measures memory at critical stages: before the query, immediately after execution (when data is fetched), and after all rows have been processed.
1. Prerequisites & Database Configuration
To run this test, you will need the following:
Java Development Kit (JDK): Version 8 or newer.
PostgreSQL Database: A running instance that you can connect to.
PostgreSQL JDBC Driver: The official .jar file for the driver (e.g., postgresql-42.x.x.jar), which you can download from the PostgreSQL website.
Before running, you must update the connection details in DatabaseFetchSizeTest.java to match your environment.
2. Running the Application
When running the application, it’s beneficial to give the Java Virtual Machine (JVM) a specific amount of memory. This makes the memory spike during the default fetch (fetchSize = 0) more noticeable.
You can set the maximum heap size using the -Xmx flag when you run the application from your terminal:
# Example: Setting max heap size to 512MB
java -Xmx512m -cp .:path/to/postgresql-42.x.x.jar DatabaseFetchSizeTest
3. Expected Observations
The most critical comparison is the memory usage reported between Stage 1 (Before Query) and Stage 2 (After Query Execution).
Fetch Size
Stage 1 to Stage 2 Memory Change
Reason
0 (Default)
Large Increase
The driver loads all 200,000 rows into the JVM’s memory immediately at Stage 2.
> 0 (Streaming)
Minimal Increase
Only a small chunk of rows (e.g., 5000) is loaded into memory at Stage 2, keeping usage low.
By running this test, you’ll see concrete proof that a streaming fetch (fetchSize > 0) is essential for maintaining memory stability when processing large volumes of data.
BLOGGERS NOTE… The original posting had verbiage where it wasn’t clear that I was referring to the planner not partition pruning vs the execution not partition pruning. Apologies for the error. The below post has been corrected:
Recently I had a customer come to me with a poorly performing query that had a perfectly fine execution time on Oracle, but once migrated to Postgres the query was slow. Upon investigation, it was found that the planning portion of the query was not pruning partitions causing a much longer planning time. That said even though the planning portion was not accomplishing partition pruning, the execution portion was (This is indicated by the portion of the explain plan notating “never executed”) .
The query had “WHERE” and “JOIN” clauses which explicitly specified partition keys and were joined on the partition key, so why wasn’t pruning happening during planning time?
The tables in question are all partitioned by “hire_date” as as you can see in the “WHERE” clause below, the planner should project partition pruning because the “hire_date” from the driving table is equal to that of the joined table, yet the planner did not prune partitions:
WITH top_emp AS (
   SELECT
       DISTINCT
       id,
       first_name,
       last_name,
       hire_date,
       birth_date
   FROM
       employees.employee_part emp
       INNER JOIN employees.salary sal on (sal.employee_id = emp.id)
   WHERE
       emp.hire_date = '1985-01-01'::date
       and emp.gender = 'M'
       and emp.birth_date between '1957-01-01'::date and '1970-01-01'::date
       and sal.amount > 50000
)
SELECT
    dept.employee_id,
    dept.department_id,
    dept.hire_date
FROM
    top_emp emp1,
    employees.department_employee_part dept
WHERE
    emp1.hire_date = dept.hire_date and
    emp1.id = dept.employee_id;

/* Explain Plan */
 Nested Loop  (cost=1467.16..2646.20 rows=307 width=17) (actual time=4.565..4.613 rows=4 loops=1)
   Output: dept.employee_id, dept.department_id, dept.hire_date
   Buffers: shared hit=330
   ->  Unique  (cost=1466.87..1471.11 rows=37 width=31) (actual time=4.537..4.560 rows=4 loops=1)
         Output: emp.id, emp.first_name, emp.last_name, emp.hire_date, emp.birth_date
         Buffers: shared hit=318
         ->  Sort  (cost=1466.87..1467.72 rows=339 width=31) (actual time=4.534..4.539 rows=69 loops=1)
               Output: emp.id, emp.first_name, emp.last_name, emp.hire_date, emp.birth_date
               Sort Key: emp.id, emp.first_name, emp.last_name, emp.birth_date
               Sort Method: quicksort  Memory: 30kB
               Buffers: shared hit=318
               ->  Nested Loop  (cost=0.43..1452.62 rows=339 width=31) (actual time=1.524..4.450 rows=69 loops=1)
                     Output: emp.id, emp.first_name, emp.last_name, emp.hire_date, emp.birth_date
                     Buffers: shared hit=309
                     ->  Seq Scan on employees.employee_part_p1985 emp  (cost=0.00..999.32 rows=37 width=31) (actual time=1.500..4.380 rows=4 loops=1)
                           Output: emp.id, emp.first_name, emp.last_name, emp.hire_date, emp.birth_date
                           Filter: ((emp.birth_date >= '1957-01-01'::date) AND (emp.birth_date <= '1970-01-01'::date) AND (emp.hire_date = '1985-01-01'::date) AND (emp.gender = 'M'::employee_gender))
                           Rows Removed by Filter: 35312
                           Buffers: shared hit=293
                     ->  Index Scan using idx_16991_primary on employees.salary sal  (cost=0.43..12.16 rows=9 width=8) (actual time=0.010..0.014 rows=17 loops=4)
                           Output: sal.employee_id, sal.amount, sal.from_date, sal.to_date
                           Index Cond: (sal.employee_id = emp.id)
                           Filter: (sal.amount > 50000)
                           Rows Removed by Filter: 1
                           Buffers: shared hit=16
   ->  Append  (cost=0.29..31.59 rows=16 width=17) (actual time=0.010..0.011 rows=1 loops=4)
         Buffers: shared hit=12
         ->  Index Scan using contract_employees_p1985_pkey on employees.department_employee_part_p1985 dept_1  (cost=0.29..2.33 rows=1 width=17) (actual time=0.006..0.006 rows=1 loops=4)
               Output: dept_1.employee_id, dept_1.department_id, dept_1.hire_date
               Index Cond: (dept_1.employee_id = emp.id)
               Filter: (emp.hire_date = dept_1.hire_date)
               Buffers: shared hit=12
         ->  Index Scan using contract_employees_p1986_pkey on employees.department_employee_part_p1986 dept_2  (cost=0.29..2.36 rows=1 width=17) (never executed)
               Output: dept_2.employee_id, dept_2.department_id, dept_2.hire_date
               Index Cond: (dept_2.employee_id = emp.id)
               Filter: (emp.hire_date = dept_2.hire_date)
         ->  Index Scan using contract_employees_p1987_pkey on employees.department_employee_part_p1987 dept_3  (cost=0.29..2.33 rows=1 width=17) (never executed)
               Output: dept_3.employee_id, dept_3.department_id, dept_3.hire_date
               Index Cond: (dept_3.employee_id = emp.id)
               Filter: (emp.hire_date = dept_3.hire_date)

......... LOTS OF PARTITIONS ........

         ->  Index Scan using contract_employees_p2000_pkey on employees.department_employee_part_p2000 dept_16  (cost=0.14..0.24 rows=1 width=17) (never executed)
               Output: dept_16.employee_id, dept_16.department_id, dept_16.hire_date
               Index Cond: (dept_16.employee_id = emp.id)
               Filter: (emp.hire_date = dept_16.hire_date)
 Settings: effective_cache_size = '3256704kB', effective_io_concurrency = '128', random_page_cost = '1.1', search_path = '"$user", public, employees', temp_buffers = '128MB', work_mem = '256MB'
 Query Identifier: -1847211568235447798
 Planning:
   Buffers: shared hit=1313
 Planning Time: 4.111 ms
 Execution Time: 5.176 ms
So if the partition keys are equal and the tables are partitioned the exact same way, then why is the planner not projecting partition pruning? The answer can be found in the Postgres Listserv by clicking here.
The planner can only push quals down into a subquery, it cannot pull quals from a subquery into the outer query.
So I want (and need the planner to partition prune) so how can I get it? Both alternatives require re-writing the query although one is a little less invasive than the other. If you know that the partition keys are exactly equal and there can only be one value, then you can modify the the where clause to have an additional entry like this (notice the additional entry in the lower “where” clause):
WITH top_emp AS (
   SELECT
       DISTINCT
       id,
       first_name,
       last_name,
       hire_date,
       birth_date
   FROM
       employees.employee_part emp
       INNER JOIN employees.salary sal on (sal.employee_id = emp.id)
   WHERE
       emp.hire_date = '1985-01-01'::date
       and emp.gender = 'M'
       and emp.birth_date between '1957-01-01'::date and '1970-01-01'::date
       and sal.amount > 50000
)
SELECT
    dept.employee_id,
    dept.department_id,
    dept.hire_date
FROM
    top_emp emp1,
    employees.department_employee_part dept
WHERE
    emp1.hire_date = dept.hire_date and
    dept.hire_date = '1985-01-01'::date and
    emp1.id = dept.employee_id;
Or, you could totally re-write the query like this so, just in case you could match multiple partitions in the other table, that situation is handled:
SELECT
   employee_id,
   department_id,
   hire_date
FROM (
   SELECT
       dept.employee_id,
       dept.department_id,
       dept.hire_date,
       count(1)
   FROM
       employees.employee_part emp
       INNER JOIN employees.salary sal on (sal.employee_id = emp.id)
       JOIN employees.department_employee_part dept on (emp.hire_date = dept.hire_date and emp.id = dept.employee_id)
   WHERE
       emp.hire_date = '1985-01-01'::date
       and emp.gender = 'M'
       and emp.birth_date between '1957-01-01'::date and '1970-01-01'::date
       and sal.amount > 50000
   GROUP BY
       dept.employee_id,
       dept.department_id,
       dept.hire_date) a;
In this case, the following plan is used and partition pruning occurs. Both planning and execution time are significantly less as well:
So as you can see it is very important to get the planner to project what you want. While ultimately the execution phase was not fully executed, it still had to look at the stats of the partition to decide not to execute it resulting in some wasted time. Also, keep in mind that this test case is a very simple one. The customer issue I worked on had a lot more partitions and a lot more data so the planning time being wasted was much higher resulting in a much higher impact.
I then created some partitioned versions of the tables from the sample database as shown below:
-- Table: test_schema.contract_employees

CREATE TABLE employees.department_employee_part (
	employee_id int8 NOT NULL,
	department_id bpchar(4) NOT NULL,
	from_date date NOT NULL,
	to_date date NOT NULL,
    hire_date date NOT NULL
)  PARTITION BY RANGE (hire_date);

-- Partitions SQL

CREATE TABLE employees.department_employee_part_p1985 PARTITION OF employees.department_employee_part
(
    CONSTRAINT department_employee_part_p1985_pkey PRIMARY KEY (employee_id, department_id)
)
    FOR VALUES FROM ('1985-01-01') TO ('1986-01-01');
CREATE TABLE employees.department_employee_part_p1986 PARTITION OF employees.department_employee_part
(
    CONSTRAINT department_employee_part_p1986_pkey PRIMARY KEY (employee_id, department_id)
)
    FOR VALUES FROM ('1986-01-01') TO ('1987-01-01');
CREATE TABLE employees.department_employee_part_p1987 PARTITION OF employees.department_employee_part
(
    CONSTRAINT department_employee_part_p1987_pkey PRIMARY KEY (employee_id, department_id)
)
    FOR VALUES FROM ('1987-01-01') TO ('1988-01-01');
CREATE TABLE employees.department_employee_part_p1988 PARTITION OF employees.department_employee_part
(
    CONSTRAINT department_employee_part_p1988_pkey PRIMARY KEY (employee_id, department_id)
)
    FOR VALUES FROM ('1988-01-01') TO ('1989-01-01');
CREATE TABLE employees.department_employee_part_p1989 PARTITION OF employees.department_employee_part
(
    CONSTRAINT department_employee_part_p1989_pkey PRIMARY KEY (employee_id, department_id)
)
    FOR VALUES FROM ('1989-01-01') TO ('1990-01-01');
CREATE TABLE employees.department_employee_part_p1990 PARTITION OF employees.department_employee_part
(
    CONSTRAINT department_employee_part_p1990_pkey PRIMARY KEY (employee_id, department_id)
)
    FOR VALUES FROM ('1990-01-01') TO ('1991-01-01');
CREATE TABLE employees.department_employee_part_p1991 PARTITION OF employees.department_employee_part
(
    CONSTRAINT department_employee_part_p1991_pkey PRIMARY KEY (employee_id, department_id)
)
    FOR VALUES FROM ('1991-01-01') TO ('1992-01-01');
CREATE TABLE employees.department_employee_part_p1992 PARTITION OF employees.department_employee_part
(
    CONSTRAINT department_employee_part_p1992_pkey PRIMARY KEY (employee_id, department_id)
)
    FOR VALUES FROM ('1992-01-01') TO ('1993-01-01');
CREATE TABLE employees.department_employee_part_p1993 PARTITION OF employees.department_employee_part
(
    CONSTRAINT department_employee_part_p1993_pkey PRIMARY KEY (employee_id, department_id)
)
    FOR VALUES FROM ('1993-01-01') TO ('1994-01-01');
CREATE TABLE employees.department_employee_part_p1994 PARTITION OF employees.department_employee_part
(
    CONSTRAINT department_employee_part_p1994_pkey PRIMARY KEY (employee_id, department_id)
)
    FOR VALUES FROM ('1994-01-01') TO ('1995-01-01');
CREATE TABLE employees.department_employee_part_p1995 PARTITION OF employees.department_employee_part
(
    CONSTRAINT department_employee_part_p1995_pkey PRIMARY KEY (employee_id, department_id)
)
    FOR VALUES FROM ('1995-01-01') TO ('1996-01-01');
CREATE TABLE employees.department_employee_part_p1996 PARTITION OF employees.department_employee_part
(
    CONSTRAINT department_employee_part_p1996_pkey PRIMARY KEY (employee_id, department_id)
)
    FOR VALUES FROM ('1996-01-01') TO ('1997-01-01');
CREATE TABLE employees.department_employee_part_p1997 PARTITION OF employees.department_employee_part
(
    CONSTRAINT department_employee_part_p1997_pkey PRIMARY KEY (employee_id, department_id)
)
    FOR VALUES FROM ('1997-01-01') TO ('1998-01-01');
CREATE TABLE employees.department_employee_part_p1998 PARTITION OF employees.department_employee_part
(
    CONSTRAINT department_employee_part_p1998_pkey PRIMARY KEY (employee_id, department_id)
)
    FOR VALUES FROM ('1998-01-01') TO ('1999-01-01');
CREATE TABLE employees.department_employee_part_p1999 PARTITION OF employees.department_employee_part
(
    CONSTRAINT department_employee_part_p1999_pkey PRIMARY KEY (employee_id, department_id)
)
    FOR VALUES FROM ('1999-01-01') TO ('2000-01-01');
CREATE TABLE employees.department_employee_part_p2000 PARTITION OF employees.department_employee_part
(
    CONSTRAINT department_employee_part_p2000_pkey PRIMARY KEY (employee_id, department_id)
)
    FOR VALUES FROM ('2000-01-01') TO ('2001-01-01');

CREATE INDEX ON employees.department_employee_part USING btree (department_id);

insert into employees.department_employee_part
select de.*,emp.hire_date
from employees.employee emp join employees.department_employee de on (emp.id = de.employee_id);

vacuum (verbose, analyze) employees.department_employee_part;

CREATE TABLE employees.employee_part (
	id int8 DEFAULT nextval('employees.id_employee_seq'::regclass) NOT NULL,
	birth_date date NOT NULL,
	first_name varchar(14) NOT NULL,
	last_name varchar(16) NOT NULL,
	gender employees.employee_gender NOT NULL,
	hire_date date NOT NULL
) PARTITION BY RANGE (hire_date);

CREATE TABLE employees.employee_part_p1985 PARTITION OF employees.employee_part
(
    CONSTRAINT employee_part_p1985_pkey PRIMARY KEY (id)
)
    FOR VALUES FROM ('1985-01-01') TO ('1986-01-01');
CREATE TABLE employees.employee_part_p1986 PARTITION OF employees.employee_part
(
    CONSTRAINT employee_part_p1986_pkey PRIMARY KEY (id)
)
    FOR VALUES FROM ('1986-01-01') TO ('1987-01-01');
CREATE TABLE employees.employee_part_p1987 PARTITION OF employees.employee_part
(
    CONSTRAINT employee_part_p1987_pkey PRIMARY KEY (id)
)
    FOR VALUES FROM ('1987-01-01') TO ('1988-01-01');
CREATE TABLE employees.employee_part_p1988 PARTITION OF employees.employee_part
(
    CONSTRAINT employee_part_p1988_pkey PRIMARY KEY (id)
)
    FOR VALUES FROM ('1988-01-01') TO ('1989-01-01');
CREATE TABLE employees.employee_part_p1989 PARTITION OF employees.employee_part
(
    CONSTRAINT employee_part_p1989_pkey PRIMARY KEY (id)
)
    FOR VALUES FROM ('1989-01-01') TO ('1990-01-01');
CREATE TABLE employees.employee_part_p1990 PARTITION OF employees.employee_part
(
    CONSTRAINT employee_part_p1990_pkey PRIMARY KEY (id)
)
    FOR VALUES FROM ('1990-01-01') TO ('1991-01-01');
CREATE TABLE employees.employee_part_p1991 PARTITION OF employees.employee_part
(
    CONSTRAINT employee_part_p1991_pkey PRIMARY KEY (id)
)
    FOR VALUES FROM ('1991-01-01') TO ('1992-01-01');
CREATE TABLE employees.employee_part_p1992 PARTITION OF employees.employee_part
(
    CONSTRAINT employee_part_p1992_pkey PRIMARY KEY (id)
)
    FOR VALUES FROM ('1992-01-01') TO ('1993-01-01');
CREATE TABLE employees.employee_part_p1993 PARTITION OF employees.employee_part
(
    CONSTRAINT employee_part_p1993_pkey PRIMARY KEY (id)
)
    FOR VALUES FROM ('1993-01-01') TO ('1994-01-01');
CREATE TABLE employees.employee_part_p1994 PARTITION OF employees.employee_part
(
    CONSTRAINT employee_part_p1994_pkey PRIMARY KEY (id)
)
    FOR VALUES FROM ('1994-01-01') TO ('1995-01-01');
CREATE TABLE employees.employee_part_p1995 PARTITION OF employees.employee_part
(
    CONSTRAINT employee_part_p1995_pkey PRIMARY KEY (id)
)
    FOR VALUES FROM ('1995-01-01') TO ('1996-01-01');
CREATE TABLE employees.employee_part_p1996 PARTITION OF employees.employee_part
(
    CONSTRAINT employee_part_p1996_pkey PRIMARY KEY (id)
)
    FOR VALUES FROM ('1996-01-01') TO ('1997-01-01');
CREATE TABLE employees.employee_part_p1997 PARTITION OF employees.employee_part
(
    CONSTRAINT employee_part_p1997_pkey PRIMARY KEY (id)
)
    FOR VALUES FROM ('1997-01-01') TO ('1998-01-01');
CREATE TABLE employees.employee_part_p1998 PARTITION OF employees.employee_part
(
    CONSTRAINT employee_part_p1998_pkey PRIMARY KEY (id)
)
    FOR VALUES FROM ('1998-01-01') TO ('1999-01-01');
CREATE TABLE employees.employee_part_p1999 PARTITION OF employees.employee_part
(
    CONSTRAINT employee_part_p1999_pkey PRIMARY KEY (id)
)
    FOR VALUES FROM ('1999-01-01') TO ('2000-01-01');
CREATE TABLE employees.employee_part_p2000 PARTITION OF employees.employee_part
(
    CONSTRAINT employee_part_p2000_pkey PRIMARY KEY (id)
)
    FOR VALUES FROM ('2000-01-01') TO ('2001-01-01');

insert into  employees.employee_part select * from  employees.employee;

vacuum (verbose, analyze) employees.employee_part;
I’m always working with customers migrating from Oracle to PostgreSQL. In both DBMS systems, there is I/O impact when using exception handlers such as when handling a PK constraint violation, but the impact in PostgreSQL is different and you should be aware of what is actually going on. For example, when an exception occurs, redo is generated in Oracle (WAL in Postgres) and additional catalog queries are issued in both DBMS systems to get pertinent data about the constraint violation. But what actually happens in Postgres as it relates to MVCC?
Let’s use a simple test to demonstrate. First, create a table with some mocked up “product” data:
/* Create the table: */
CREATE TABLE public.pk_violation_test (
		id int PRIMARY KEY,
		value numeric,
		product_id int,
		effective_date timestamp(3)
		);


/* Insert some mocked up data */
INSERT INTO public.pk_violation_test VALUES (
		generate_series(0,10000),
		random()*1000,
		random()*100,
		current_timestamp(3));

/* Verify that there are no dead tuples: */
SELECT
    schemaname,
    relname,
    n_live_tup,
    n_dead_tup
FROM
    pg_stat_all_tables
WHERE
    relname = 'pk_violation_test';

 schemaname |      relname      | n_live_tup | n_dead_tup
------------+-------------------+------------+------------
 public     | pk_violation_test |    100001  |          0
Now, we will execute a simple insert statement using no directive:
/* Perform a simple insert: */
INSERT INTO pk_violation_test
    VALUES (0, 44.33893489873, 46, now());

ERROR:  duplicate key value violates unique constraint "pk_violation_test_pkey"
DETAIL:  Key (id)=(0) already exists.
Time: 1.292 ms

/* Verify the dead tuple count: */
SELECT
    schemaname,
    relname,
    n_live_tup,
    n_dead_tup
FROM
    pg_stat_all_tables
WHERE
    relname = 'pk_violation_test';

 schemaname |      relname      | n_live_tup | n_dead_tup
------------+-------------------+------------+------------
 public     | pk_violation_test |    100001  |          1
As you can see the error is produced that the insert violated the PK and the tuple which was in violation is now a dead tuple.
Now change the insert to use the “ON CONFLICT” directive and check the dead tuple count:
/* Perform a simple insert using the directive: */
INSERT INTO pk_violation_test
    VALUES (0, 44.33893489873, 46, now())
ON CONFLICT
    DO NOTHING;

INSERT 0 0
Time: 0.889 ms

/* Verify the unchanged dead tuple count: */
SELECT
    schemaname,
    relname,
    n_live_tup,
    n_dead_tup
FROM
    pg_stat_all_tables
WHERE
    relname = 'pk_violation_test';

 schemaname |      relname      | n_live_tup | n_dead_tup
------------+-------------------+------------+------------
 public     | pk_violation_test |    100001  |          1
As you can see the dead tuple count did not increase, thus reducing the amount of vacuum needed!
Now, most of the code conversion tools might try to do something with that exception block. Maybe it gets converted into something like this:
/* Create a simple function with exception logic: */
CREATE OR REPLACE FUNCTION pk_violation_test_func (p_id int, p_value numeric, p_product_id int)
    RETURNS VOID
    AS $$
BEGIN
    BEGIN
        INSERT INTO pk_violation_test (id, value, product_id, effective_date)
            VALUES (p_id, p_value, p_product_id, now());
        RETURN;
    EXCEPTION
        WHEN unique_violation THEN
            -- try an update
            UPDATE
                pk_violation_test
            SET
                value = p_value,
                product_id = p_product_id,
                effective_date = now()
            WHERE
                id = p_id;
    IF found THEN
        RETURN;
        END IF;
    END;
END;

$$
LANGUAGE plpgsql;
So what happens in this case? Watch how now we get TWO dead tuples. One for the insert and one for the update (if it’s not a HOT Update). I will vacuum the table first so that there is no question around how many dead tuples there are:
/* Vacuum the table: */
vacuum pk_violation_test;

/* Verify the dead tuple count: */
SELECT
    schemaname,
    relname,
    n_live_tup,
    n_dead_tup
FROM
    pg_stat_all_tables
WHERE
    relname = 'pk_violation_test';
 schemaname |      relname      | n_live_tup | n_dead_tup
------------+-------------------+------------+------------
 public     | pk_violation_test |    1000001 |          0

/* Call the sample function */
select * from pk_violation_test_func(0, 44.33893489873, 46);
 pk_violation_test_func
------------------------

(1 row)

/* Verify the dead tuple count: */
SELECT
    schemaname,
    relname,
    n_live_tup,
    n_dead_tup
FROM
    pg_stat_all_tables
WHERE
    relname = 'pk_violation_test';
 schemaname |      relname      | n_live_tup | n_dead_tup
------------+-------------------+------------+------------
 public     | pk_violation_test |    1000001 |          2
As you can see the insert attempt using the “ON CONFLICT” directive did not create a dead tuple. In turn this will make your inserts which violate a PK more efficient, faster and not cause unnecessary vacuum. Remember that logging message that was a result of the PK violation not being handled? That log message is gone too. A WIN all around!
Point being that it is very important to understand whatever DBMS you are running it. Things that seem very simple can have pros and cons that need to be dealt with.
There are several benefits to using temp tables in SQL DML operations. Given my long relationship and work on Oracle databases, I am highly familiar with the Oracle style “Global Temporary Tables” and have used them to solve many performance issues when complex joins are involved. That’s why I was excited when Gilles Darold released the extension “pgtt” for PostgreSQL. I was even more excited when Google released the extension for use in the Google CloudSQL for Postgres and AlloyDB for Postgres products.
In my opinion, native Postgres temporary tables leave a lot to be desired. For example, each table has to be created upon use. Nothing is persistent. This takes time and leads to Postgres catalog bloat (looking to do a post on this soon). That being said, in self managed instances, ‘pgtt’ is very easy to use. You can load the extension either at connection time by user, or for anyone that connects to a database. For example (make sure the extension is created in the database before setting these):
alter role test_user SET session_preload_libraries to 'pgtt';

alter database test_pgtt SET session_preload_libraries = 'pgtt';
This will, by default, use the ‘pgtt’ version of temporary tables instead of the default temporary tables Postgres offers. You can then create ‘pgtt’ style tables and refer to them via the pgtt_schema with no further modifications.
To revert back in the session, you must “disconnect” the session alter the user / database to revert the behavior to “old” style temporary tables. To my knowledge, if the library is enabled this way there is no way to use both styles of temporary tables at the same time.
alter role test_user RESET session_preload_libraries;

alter database pgtt_test RESET session_preload_libraries;
The Set Up…..
/* set flag "pgtt.enabled" on alloydb / cloudsql postgres console  to on */

/* create the extension in every database you need to use global temp tables */
CREATE EXTENSION pgtt;
LOAD 'pgtt';

/* Additional extensions needed for this test */
CREATE EXTENSION "uuid-ossp";

/* create the persistent global temporary table */
CREATE /*GLOBAL*/ TEMPORARY TABLE test_gtt_table (
id integer,
lbl text) ON COMMIT DELETE ROWS;

/* create an index on the global temp table */
CREATE INDEX ON pgtt_schema.test_gtt_table (id);
Use of ‘pgtt’ in Cloud Database Products
When you look at managed Cloud databases (from any vendor), you have to understand that some items need to be locked down in order to safeguard against the “managed” nature of the product. Unfortunately (as of this writing), at least in Google Cloud Postgres products, you cannot manipulate the parameter “session_preload_libraries”. So then you ask “How can I programmatically use the extension”? As the time of this writing, I have found only two ways. Either the user has to explicitly execute “LOAD ‘pgtt'” at the beginning / at some point in their session or the “LOAD” must be embedded in a function / procedure similar to the following:
/* function definition with loading of extension as a work around */
create or replace function public.test_gtt_function(P_IN_IDS integer[])
	returns table (
		id integer,
		lbl text
	)
    language plpgsql
AS $func$
BEGIN
LOAD 'pgtt';
	/* revised query below */
	INSERT INTO pgtt_schema.test_gtt_table
		select generate_series,substr(uuid_generate_v4()::text,1,15) FROM generate_series(1, 5000);
	RETURN QUERY
	SELECT mygtt.id,mygtt.lbl from pgtt_schema.test_gtt_table mygtt where mygtt.id = ANY (P_IN_IDS);
END
$func$;
As you can see in the above function, the “LOAD” directive is the first thing in the function. While I am not a fan of having to do it this way, there doesn’t seem to be a huge performance impact but one nonetheless that you must account for:
(postgres@##########:5432) [tpcc] > LOAD 'pgtt';
LOAD
Time: 3.811 ms
(postgres@##########:5432) [tpcc] > \watch 1
LOAD
Time: 2.922 ms
LOAD
Time: 1.219 ms
LOAD
Time: 1.335 ms
LOAD
Time: 1.300 ms
LOAD
Time: 1.282 ms
LOAD
One reason I do like the implementation within the function is that it is easier to remove the directive vs the directive being embedded within the code. Either way the right direction is to get the vendor to allow targeted values for this parameter. This will allow the most flexibility and the least amount of awareness and hassle when using this extension.
So What Happens If You Don’t Load The Library??
So if you do not load the library with one of the options above, the functions still works. But what happens? The table actually behaves as a “real” table and the data is never truncated… Even after disconnection:
Pretty crazy. So if for some reason the LOAD does not occur or fails, there could be an issue where the temp table has duplicate rows.
So what happens if the “pgtt” temp table was never created? You get a failure as you expect:
(postgres@#######:5432) [tpcc] > select * from public.test_gtt_wo_load_function(:ids);
ERROR:  relation "pgtt_schema.test_gtt_table" does not exist
LINE 1: INSERT INTO pgtt_schema.test_gtt_table
                    ^
QUERY:  INSERT INTO pgtt_schema.test_gtt_table
select generate_series,substr(uuid_generate_v4()::text,1,15) FROM generate_series(1, 5000)
CONTEXT:  PL/pgSQL function test_gtt_wo_load_function(integer[]) line 4 at SQL statement
Time: 5.204 ms
So it is important to ensure that if you intend to use “pgtt” you have a programmatic method to load the extension….. and in the meantime, I will be working on my end to get a cleaner way to load it in the managed products I have access to.
The other day I found myself needing to explain to some developers why their use-case of the Oracle ‘rownum’ pseudocolumn was yielding a result in one database instance, but a completely different result in another.
In this situation, the correct result is the ‘maximum’ value of the column, however this query was also occasionally returning the exact ‘minimum’ value of this column. How could this happen? The answer lies in the using the ‘rownum’ pseudocolumn correctly. Of course there are other (probably better) ways to write this query without the use of ‘rownum’, but I’m not here to debate that right now….
** Note the tables in the query have been changed to protect the innocent.
select column_a from (select column_a,rownum rowid0 from schema.table order by column_a desc ) aa where aa.rowid0 =1;
Oracle documentation states that it depends how Oracle accessed the rows in the query as to which result you will get. For example your results can vary depending on a lot of factors (ie: the order that you inserted the data in the table or if there is an index on the table and how that index is used). For further information you can see the documentation here:
---------------------------------------------------------------------------------------------------------
| Id  | Operation               | Name                          | Rows  | Bytes | Cost (%CPU)| Time     |
---------------------------------------------------------------------------------------------------------
|   0 | SELECT STATEMENT        |                               |       |       |     4 (100)|          |
|*  1 |  VIEW                   |                               |  1257 | 32682 |     4  (25)| 00:00:01 |
|   2 |   SORT ORDER BY         |                               |  1257 |  6285 |     4  (25)| 00:00:01 |
|   3 |    COUNT                |                               |       |       |            |          |
|   4 |     INDEX FAST FULL SCAN| SCHEMA_TABLE_PK               |  1257 |  6285 |     3   (0)| 00:00:01 |
---------------------------------------------------------------------------------------------------------

Predicate Information (identified by operation id):
---------------------------------------------------

   1 - filter("AA"."ROWID0"=1)


24 rows selected.
As you can see, the major difference here is that the two systems have not chosen the same access path in which to return the data. In one system a plan utilized an ‘INDEX FULL SCAN DESCENDING’ access path, while the other utilized an ‘INDEX FAST FULL SCAN’ access path.
“An index fast full scan reads the ENTIRE index, unsorted, as it exists on disk. It is basically using the index as a “skinny” version of the table. The query in question would only be accessing attributes in the index (we are not using the index as a way to get to the table, we are using the index INSTEAD of the table) We use multiblock IO and read all of the leaf, branch and the root block. We ignore the branch and root blocks and just process the (unordered) data on the leaf blocks.
An index full scan is when we read the index a block at a time – from start to finish. We’ll read the root block, navigate down the left hand side of the index (or right if we are doing a descending full scan) and then when we hit the leaf block – we’ll read across the entire bottom of the index – a block at a time – in sorted order. We use single block IO, not multiblock IO for this operation.”
Well there you have it. And this is why the result is different. How can we keep this from occurring in the future? The answer is to utilize the ‘rownum’ pseudocolumn correctly. Remember, rownum is not a real column so in order to get the right results, it needs to be added after the data is in the sorted order that you want. To do that, make sure you write the query so that ‘rownum’ is applied after the sort. Using the same query above, lets ‘rewrite’ it in such a way that it will achieve the desired results:
select column_a from (select column_a,rownum from (select column_a from schema.table order by column_a desc)) where rownum = 1;
See the steps now?
Retrieve data in sorted order
Apply the ‘rownum’ pseudocolumn
Filter for the desired value in the list
If you must use the ‘rownum’ pseudocolumn, writing your query in this manner will ensure that you always get the same result.