Tag Archives: Oracle

Indexes Can Check-Out Anytime, But Can They Leave?

When I think about indexes in any DBMS, I immediately think about the lyrics in the Eagles song “Hotel California”.

“You can check-out any time you like, but you can never leave…..”

Almost every system that has been around for a while is over indexed. Every index costs something to maintain and some more than others. Also, systems and code change. There could be an index that was once needed, but over time the code shifts to use another one thats more efficient instead. Guess what though, you are still maintaining that old index. That costs CPU, I/O which translates into TIME.

Thankfully in Oracle 12.2, they have introduced a feature called INDEX USAGE TRACKING. In older versions this was called INDEX MONITORING and it was much harder and invasive to use. In the newer versions, it just works and you can read more about both options here:

https://oracle-base.com/articles/12c/index-usage-tracking-12cr2

By default, indexes in the views “DBA_INDEX_USAGE” and “V$INDEX_USAGE_INFO”. The “V$” table is flushed to the “DBA” table every 15 minutes. For most purposes, using the “DBA” table is just fine. The thing to remember is that querying only these tables tell you the indexes that are being USED, not the ones that are NOT USED. To get the ones that are not used, we just need to expand the query a bit:

SELECT
    di.owner,
    di.index_name,
    di.index_type,
    di.table_name
FROM
    dba_indexes di
WHERE
             di.owner in (select username from dba_users where oracle_maintained = 'N')
    AND di.uniqueness = 'NONUNIQUE'
    AND NOT EXISTS (
        SELECT
            1
        FROM
            dba_index_usage iu
        WHERE
                iu.owner = di.owner
            AND iu.name = di.index_name
    )
GROUP BY
    di.owner,
    di.index_name,
    di.index_type,
    di.table_name
ORDER BY
    di.owner,
    di.table_name,
    di.index_name;

Now that we have the indexes that are not used, which ones have the biggest impact on database operations? We just expand the query again to leverage the “DBA_TAB_MODIFICATIONS” table. This will allow us to see how many operations occur on each table that the index sits on:

SELECT
    di.owner,
    di.index_name,
    di.index_type,
    di.table_name,
    SUM(tm.inserts + tm.updates + tm.deletes) operations
FROM
    dba_indexes di,
    dba_tab_modifications tm
WHERE
             di.owner in (select username from dba_users where oracle_maintained = 'N')
    AND di.owner = tm.table_owner
    AND di.table_name = tm.table_name
    AND di.uniqueness = 'NONUNIQUE'
    AND NOT EXISTS (
        SELECT
            1
        FROM
            dba_index_usage iu
        WHERE
                iu.owner = di.owner
            AND iu.name = di.index_name
    )
GROUP BY
    di.owner,
    di.index_name,
    di.index_type,
    di.table_name
ORDER BY
    SUM(tm.inserts + tm.updates + tm.deletes) ASC NULLS FIRST,
    di.owner,
    di.table_name,
    di.index_name;

Now, I have done an equi-join condition against the DBA_TAB_MODIFICATIONS so this is only showing us unused indexes against tables that the system has recorded operations against. If you wanted to show all indexes regardless if there were operations or not, then just change the join condition against DBA_TAB_MODIFICATIONS to be an outer join.

In my case, there were some very large indexes that were unused sitting on tables that had LOTS of operations (names changed to protect the innocent):

OWNERINDEX NAMEINDEX TYPETABLE NAMEOPERATIONS
HRFK_1_IDXNORMALEMPLOYEES295931545
HR1EMP_TOTFUNCTION-BASED NORMALEMP_HOURS1374288673
HR2EMP_TOTFUNCTION-BASED NORMALEMP_HOURS1425114200
HR3EMP_TOTFUNCTION-BASED NORMALEMP_HOURS2487284020

Adding “OPERATIONS” to the query now gives us some sense of the “BENEFIT” of dropping the index. Based on the results you can present your case for dropping the index. People always love to have the “BENEFIT” quantified and this is the closest thing you can do without performing a session trace which could prove to be invasive and fairly difficult to get the exact statement you are looking for.

Hopefully this will give you the additional information you need to advocate for dropping that index that is no longer being used.

SQLPlus is Expensive!


I was recently tasked to work on a server that had severe performance issues. The first thing I noticed was that the server was, at times, running at a load average 3-4x and under steady state about 1.5x the number of cores on the host! Further investigation, yielded that there was a large quantity of SQPlus invocations from a set of ETL scripts. Digging even more, I found that the script performed ETL across more than 100 schemas 75% of which were done via parallel background processes with a random “sleep” built in.

This is where I noticed something interesting. Instead of coding the script to invoke SQLPlus once, run a bunch of statements and exit, the coder constructed the script to invoke SQLPlus, run a statement, exit, invoke SQLPlus, run a statement, and on and on and on.

My first thought was that this has to be EXPENSIVE right?

When a SQLPlus login is made, a lot of things happen. Simply stated, the OS has to start a database process, and the database has to do a bunch of things to get your session ready (password authentication, memory allocation, update some tables with login details, setup permissions), etc, etc. Managing processes is one of the most expensive things an Operating System can do.

In terms of the database itself, no less than 19 individual statements are executed in order to prepare your session. Digging into those statements, probably one of the most expensive is:

sql_id:  9zg9qd9bm4spu
update user$ set spare6=DECODE(to_char(:2, 'YYYY-MM-DD'), '0000-00-00', to_date(NULL), :2) where user#=:1


It can be so expensive, Oracle has actually logged a bug (Bug 33121934  Library cache lock / load lock / mutex x during connection storm due to update user$) where you can discontinue updating the last login time for every login and do it every X number of seconds. The explain plan for this statement is actually quite lengthy and there is a lot more work going on than you think!

So based on all of that, I headed back to my scripts only to discover for every invocation of the script (the script is invoked for each of the 114 schemas), there were a minimum of 11 SQLPlus invocations and a max of of 27 invocations depending on the schema. So every minute that this script was executed there was a total of almost 1400 SQLPlus Invocations!!! Definitely a big contributor to the very high load average on the server.

As with anything in IT, change is tough and there’s hardly ever much appetite to change something that “works”. That is where it is important to always quantify the benefits. So to do this I wrote a quick script to show the difference in CPU Utilization for a script that does many SQLPlus invocations vs one that does one invocation and then calls many sql scripts.

The resultant stats are as follows. For the original script in the test system I used had one SQLPlus invocation for each sql file that was called, the following resources were used. The original script executed SQLPlus 61 times and yielded the following system usage:

real     0m0.876s
user     0m0.480s
sys      0m0.463s

The modified script that reduced the number of calls from 61 to 14 (77%) yielded the following system usage:

real     0m0.188s
user     0m0.117s
sys      0m0.085s

*** NOTE: The test system I was working on had no data to manipulate for ETL so most of the work was the SQLPlus call. Which is what I wanted to demonstrate anyway!

As you can see, reducing the number of SQLPlus calls by 77%, reduced system usage by:

  • real: 79%
  • user: 75%
  • sys: 82%

So with a small change to group sql statements into one SQLPlus call, we are able to drastically improve system stability and reduce resource utilization. A WIN in my book! Once this gets through the test cycles, I will follow up with a post on the improvement seen in production.

Why Aren’t My Exadata Database Queries Performing Smart Scans?


Recently, I was performing prerequisite checks on an Exadata in preparation for the normal quarterly full stack patch and in doing so came across a section of the Exacheck with the heading “Database should not be in DST upgrade state“. Upon investigation I found that to be true:

select name, value$ from sys.props$ where name like '%DST%';

NAME			       VALUE$
------------------------------ ------------------------------
DST_UPGRADE_STATE	       UPGRADE
DST_PRIMARY_TT_VERSION	       32
DST_SECONDARY_TT_VERSION       18

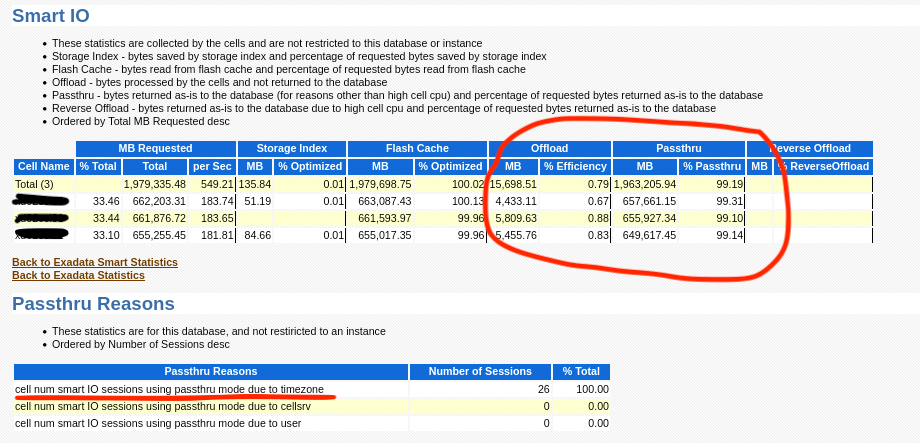
Based on this, I took this as an action item to correct during the patching cycle and continued the normal checks and a quick look through recent AWRs. Is was then that I found something interesting in the “Exadata” section of the report:

As you can see, nothing is being offloaded and in the “Passthru Reasons” section “timezone” is the culprit. I then went to look at a query or two and sure enough, that confirms it:


So sure enough a stuck timezone file upgrade can cause the entire reason you bought an Exadata not to work! The date it quit working also coincides with when an upgrade to 19c occurred. Another quick sanity check of MOS also revealed the following note:

Exadata: Database Performance Degrades when Database is in Timezone Upgrade Mode (Doc ID 1583297.1)

So now, how to fix it? The note says to try the following commands, but unfortunately that did not work:

alter session set events '30090 trace name context forever, level 32';
exec dbms_dst.unload_secondary;
BEGIN dbms_dst.unload_secondary; END;

*
ERROR at line 1:
ORA-56938: no secondary time zone data file being loaded by on-demand or a datapump job
ORA-06512: at "SYS.DBMS_DST", line 1969
ORA-06512: at "SYS.DBMS_SYS_ERROR", line 79
ORA-06512: at "SYS.DBMS_DST", line 1906
ORA-06512: at line 1

So at this point we could either try the timezone upgrade again, or try to force the timezone upgrade window to close. The following MOS note discusses the timezone upgrade process:

Updating the RDBMS DST version in 12c Release 1 (12.1.0.1 ) and above using DBMS_DST (Doc ID 1509653.1)

Due to time, I decided to try forcing the upgrade window to close (as all other indicators showed that the upgrade was successful on all other objects) and immediately we found the reason why the upgrade failed in the first place…. An invalid and UNUSED version of APEX!!!

alter session set "_with_subquery"=materialize;
alter session set "_simple_view_merging"=TRUE;
set serveroutput on
VAR numfail number
BEGIN
DBMS_DST.UPGRADE_DATABASE(:numfail,
parallel => TRUE,
log_errors => TRUE,
log_errors_table => 'SYS.DST$ERROR_TABLE',
log_triggers_table => 'SYS.DST$TRIGGER_TABLE',
error_on_overlap_time => FALSE,
error_on_nonexisting_time => FALSE);
DBMS_OUTPUT.PUT_LINE('Failures:'|| :numfail);
END;
/
VAR fail number
BEGIN
DBMS_DST.END_UPGRADE(:fail);
DBMS_OUTPUT.PUT_LINE('Failures:'|| :fail);
END;
/
SELECT PROPERTY_NAME, SUBSTR(property_value, 1, 30) value
FROM DATABASE_PROPERTIES
WHERE PROPERTY_NAME LIKE 'DST_%'
ORDER BY PROPERTY_NAME;
Table list: "APEX_040200"."WWV_FLOW_FEEDBACK"
BEGIN
*
ERROR at line 1:
ORA-04098: trigger 'APEX_040200.WWV_FLOW_FEEDBACK_T1' is invalid and failed re-validation
ORA-06512: at "SYS.DBMS_DST", line 1131
ORA-06512: at "SYS.DBMS_DST", line 611
ORA-06512: at "SYS.DBMS_DST", line 209
ORA-06512: at "SYS.DBMS_DST", line 858
ORA-06512: at "SYS.DBMS_DST", line 596
ORA-06512: at "SYS.DBMS_DST", line 1123
ORA-06512: at line 2

After following the normal process to remove those old versions of APEX (I am a believer in removing it period if you aren’t using it), I was then able to close the upgrade window for timezone with no errors:

select name, value$ from sys.props$ where name like '%DST%';

NAME			       VALUE$
------------------------------ ------------------------------
DST_UPGRADE_STATE	       UPGRADE
DST_PRIMARY_TT_VERSION	       32
DST_SECONDARY_TT_VERSION       18

alter session set "_with_subquery"=materialize;

Session altered.

alter session set "_simple_view_merging"=TRUE;

Session altered.

set serveroutput on
VAR numfail number
BEGIN
DBMS_DST.UPGRADE_DATABASE(:numfail,
parallel => TRUE,
log_errors => TRUE,
log_errors_table => 'SYS.DST$ERROR_TABLE',
log_triggers_table => 'SYS.DST$TRIGGER_TABLE',
error_on_overlap_time => FALSE,
error_on_nonexisting_time => FALSE);
DBMS_OUTPUT.PUT_LINE('Failures:'|| :numfail);
END;
/
Table list: "APEX_200200"."WWV_FLOW_WORKSHEET_NOTIFY"
Number of failures: 0
Table list: "APEX_200200"."WWV_FLOW_WEB_SRC_MODULES"
Number of failures: 0
Table list: "APEX_200200"."WWV_FLOW_ACTIVITY_LOG2$"
Number of failures: 0
Table list: "APEX_200200"."WWV_FLOW_DEBUG_MESSAGES"
Number of failures: 0
Table list: "APEX_200200"."WWV_FLOW_DEBUG_MESSAGES2"
Number of failures: 0
Table list: "APEX_200200"."WWV_FLOW_WEBSOURCE_SYNC_LOG1$"
Number of failures: 0
Table list: "APEX_200200"."WWV_FLOW_WEBSOURCE_SYNC_LOG2$"
Number of failures: 0
Table list: "APEX_200200"."WWV_FLOW_AUTOMATION_LOG1$"
Number of failures: 0
Table list: "APEX_200200"."WWV_FLOW_AUTOMATION_LOG2$"
Number of failures: 0
Table list: "APEX_200200"."WWV_FLOW_AUTOMATION_MSG_LOG1$"
Number of failures: 0
Table list: "APEX_200200"."WWV_FLOW_AUTOMATION_MSG_LOG2$"
Number of failures: 0
Table list: "APEX_200200"."WWV_FLOW_FEEDBACK"
Number of failures: 0
Table list: "APEX_200200"."WWV_FLOW_FEEDBACK_FOLLOWUP"
Number of failures: 0
Table list: "APEX_200200"."WWV_FLOW_PKG_APP_INSTALL_LOG"
Number of failures: 0
Table list: "APEX_200200"."WWV_FLOW_ACTIVITY_LOG1$"
Number of failures: 0
Table list: "APEX_200200"."APEX$ARCHIVE_HEADER"
Number of failures: 0
Table list: "APEX_200200"."APEX$ARCHIVE_CONTENTS"
Number of failures: 0
Table list: "APEX_200200"."APEX$ARCHIVE_HISTORY"
Number of failures: 0
Table list: "APEX_200200"."APEX$ARCHIVE_LOG"
Number of failures: 0
Table list: "APEX_200200"."APEX$ARCHIVE_PREF"
Number of failures: 0
Table list: "APEX_200200"."WWV_FLOW_AUTOMATIONS"
Number of failures: 0
Failures:0

PL/SQL procedure successfully completed.

VAR fail number
BEGIN
DBMS_DST.END_UPGRADE(:fail);
DBMS_OUTPUT.PUT_LINE('Failures:'|| :fail);
END;
/
An upgrade window has been successfully ended.
Failures:0

PL/SQL procedure successfully completed.

select name, value$ from sys.props$ where name like '%DST%';

NAME			       VALUE$
------------------------------ ------------------------------
DST_UPGRADE_STATE	       NONE
DST_PRIMARY_TT_VERSION	       32
DST_SECONDARY_TT_VERSION       0

Now after changing this, you can now see that the “Passthru Reasons” section is no longer populated and all cell offloads are occurring again:

Confirming via looking at AWR also shows the query now getting proper offload:

So the moral of the story is that when performing an upgrade, take extra care to check if there are invalid objects along the way and also don’t proceed unless it is properly resolved! Also, consider removing features of the database if you are not using them. It will lessen the chance for there being outliers causing problems and your upgrade will actually complete faster!

Enjoy!

Using Python Along with the Oracle GoldenGate Big Data Adapter Integrated Heartbeat

In my previous blog post, https://stborden.wordpress.com/2021/08/27/enabling-and-use-of-the-oracle-goldengate-big-data-adapter-integrated-heartbeat/, I showed how to enable the heartbeat for the GoldenGate Big Data Adapter. In this post, we will extend this facility using python to read this data and provide lag information for the replication path over different time periods.

Python is a perfect language to iterate over the json generated by the integrated heartbeat. For ease, I have posted the script in the code block below, but it is also available on my GitHub site:

https://github.com/shane-borden/goldengate-scripts/blob/main/ogg_big_data_heartbeat_report.py


#!/bin/python3
# Python program to read ogg heartbeat history json file

import json
import time
import datetime
import os
import glob
import sys, getopt

def main(argv):
  # Initialize Variables
  vLagJsonDir = ''
  try:
    opts, args = getopt.getopt(argv,"h:j:",["jsondir="])
    if len(opts) == 0:
      print('Script Usage: ogg_big_data_heartbeat_report.py -j ')
      sys.exit(1)
  except getopt.error as err:
    print('Script Usage: ogg_big_data_heartbeat_report.py -j ')
    sys.exit(2)
  for opt, arg in opts:
    if opt == '-h':
      print('Script Usage: ogg_big_data_heartbeat_report.py -j ')
      sys.exit()
    #elif opt in ("-j", "--jsondir"):
    elif opt == '-j':
      vLagJsonDir = arg
    elif opt == '--jsondir':
      vLagJsonDir = arg

  vTotLag = 0
  vTotJsonRecords = 0
  vTotLag_1hour = 0
  vTotJsonRecords_1hour = 0
  vTotLag_4hour = 0
  vTotJsonRecords_4hour = 0
  vTotLag_8hour = 0
  vTotJsonRecords_8hour = 0
  vTotLag_24hour = 0
  vTotJsonRecords_24hour = 0
  now = time.mktime(datetime.datetime.now().timetuple())
  if vLagJsonDir == "":
    vLagJsonDir = "/u01/app/oracle/product/oggBd/19.1/gg_1/dirtmp/"
    print('JSON Dir defaulted to: ' + str(vLagJsonDir))
  else:
    print('JSON Dir is: ' + str(vLagJsonDir))
  lag_records = []
  heartbeat_timestamp_records = []
  replication_path_records = []

  # Opening JSON file
  for filename in glob.glob(vLagJsonDir + '/*-hb-[0-9][0-9][0-9][0-9]-[0-9][0-9]-[0-9][0-9].json'):
    #print(os.path.join(vLagJsonDir + "/", filename))
    f = open(os.path.join(vLagJsonDir + "/", filename))

    # returns JSON object as
    # a dictionary
    data = json.load(f)

    # Iterating through the json
    # list
    for i in data['records']:
      vIncomingTs = time.mktime(datetime.datetime.strptime(i['incomingHeartbeatTs'][:-3],"%Y-%m-%d %H:%M:%S.%f").timetuple())
      vOutgoingTs = time.mktime(datetime.datetime.strptime(i['outgoingReplicatTs'][:-3],"%Y-%m-%d %H:%M:%S.%f").timetuple())
      vIncomingHeartbeatTs = datetime.datetime.strptime(i['incomingHeartbeatTs'][:-3],"%Y-%m-%d %H:%M:%S.%f").strftime('%Y-%m-%d %H:%M')
      heartbeat_timestamp_records.append(vIncomingHeartbeatTs)
      #print(str(now - vOutgoingTs))
      if (now - vOutgoingTs)  " + i['incomingRoutingPath'] + " => " + i['incomingReplicat'] + " | " + vIncomingHeartbeatTs + " | " + str(vOutgoingTs - vIncomingTs))
        replication_path_records.append(i['incomingExtract'] + " => " + i['incomingRoutingPath'] + " => " + i['incomingReplicat'])
      elif (now - vOutgoingTs) <= 14400:
        vTotLag_4hour = vTotLag_4hour + (vOutgoingTs - vIncomingTs)
        vTotJsonRecords_4hour = (vTotJsonRecords_4hour + 1)
      elif (now - vOutgoingTs) <= 28800:
        vTotLag_8hour = vTotLag_8hour + (vOutgoingTs - vIncomingTs)
        vTotJsonRecords_8hour = (vTotJsonRecords_8hour + 1)
      elif (now - vOutgoingTs)  0:
    print("Average Lag over the past hour: " + str(vTotLag_1hour // vTotJsonRecords_1hour) + " seconds")
  if vTotJsonRecords_4hour > 0:
    print("Average Lag over the past 4 hours: " + str(vTotLag_4hour // vTotJsonRecords_4hour) + " seconds")
  if vTotJsonRecords_8hour > 0:
    print("Average Lag over the past 8 hours: " + str(vTotLag_8hour // vTotJsonRecords_8hour) + " seconds")
  if vTotJsonRecords_24hour > 0:
    print("Average Lag over the past 24 hours: " + str(vTotLag_24hour // vTotJsonRecords_24hour) + " seconds")
  print("Average Lag over the dataset (" + str(vTimeDiff) + " Days): " + str(vTotLag // vTotJsonRecords) + " seconds")

if __name__ == "__main__":
  if len(sys.argv) < 1:
    print('Script Usage: ogg_big_data_heartbeat_report.py -j ')
    sys.exit(2)
  else:
    main(sys.argv[1:])

Now, to execute the script its quite easy. Just tell the script where the json files are and it will aggregate the results over the past hour, 4 hours, 8 hours, 24 hours and the entire dataset:

oracle@orcl-vbox2:/home/oracle $ ogg_big_data_heartbeat_report.py -j /u01/app/oracle/product/oggBd/19.1/gg_1/dirtmp
JSON Dir is: /u01/app/oracle/product/oggBd/19.1/gg_1/dirtmp

Replication Paths:
E_HR_CL => P_HR_CL => RKFJSCON

Combined Lag Data for Replication Paths:

Average Lag over the past hour: 6.0 seconds
Average Lag over the past 4 hours: 6.0 seconds
Average Lag over the past 8 hours: 6.0 seconds
Average Lag over the past 24 hours: 6.0 seconds
Average Lag over the dataset (18.0 Days): 443446.0 seconds

I’ve only had my VM up for the past day or so, so the data for the entire dataset is skewed as there was a several day period where the VM was down.

Now you can extend this even further if you like to execute on a timely bases from OEM so that historical data can be kept or from any other scheduling tool you might have. Enjoy!

Enabling and Use of the Oracle GoldenGate Big Data Adapter Integrated Heartbeat

I have always found the Integrated Heartbeat for GoldenGate very useful for quickly identifying replication trends and potential slowness in the replication path. Luckily in GoldenGate Big Data Adapter Version 19c they have extended this functionality for the Big Data Adapter. My goal with this blog post is to show how easy it is to enable the heartbeat and to demonstrate a python script to utilize the data the heartbeat produces.

First, enable the heartbeat on the source just as you normally would. I won’t cover how to do that in this post, but for GoldenGate 19c, the instructions can be found here:

https://docs.oracle.com/en/middleware/goldengate/core/19.1/gclir/add-heartbeattable.html#GUID-126E30A2-DC7A-4C93-93EC-0EB8BA7C13CB

Enabling the HeartBeat for the Big Data Adapter

Luckily, enabling the heartbeat for the big data adapter is just as easy as in the normal Goldengate CLI. The official reference is here:

https://docs.oracle.com/en/middleware/goldengate/big-data/19.1/gbdin/automatic-heartbeat-bigdata.html#GUID-56DF810A-A417-45DB-A3ED-2D902B800778

For expedience, I will show the basic usage of the command here. After logging into GGSCI, enabling the target heartbeat is as easy as:

Oracle GoldenGate for Big Data
Version 19.1.0.0.8 (Build 002)

Oracle GoldenGate Command Interpreter
Version 19.1.0.0.210228 OGGCORE_19.1.0.0.0OGGBP_PLATFORMS_210212.1752.2
Linux, x64, 64bit (optimized), Generic  on Mar 18 2021 07:13:36
Operating system character set identified as UTF-8.

Copyright (C) 1995, 2021, Oracle and/or its affiliates. All rights reserved.


GGSCI (orcl-vbox2.localdomain.com) 1> ADD HEARTBEATTABLE
Heartbeat table is now enabled.
HEARTBEAT configuration file dirprm/heartbeat.properties
heartbeat.enabled=true
heartbeat.frequency=60
heartbeat.retention_time=30
heartbeat.purge.frequency=1
heartbeat.db.name=BigData

Now that the heartbeat has been enabled where does the data go? The heartbeat information (by default) is under your GOLDENGATE_HOME/dirtmp directory in the form of JSON files:

RKFJSCON-hb.json – Data for Last Heartbeat

The last heartbeat recorded looks like this:

{
“localDatabase” : “BigData”,
“heartbeatTimestamp” : “2021-08-27 13:17:14.149808000”,
“remoteDatabase” : “VBOXNCDB”,
“incomingExtract” : “E_HR_CL”,
“incomingRoutingPath” : “P_HR_CL”,
“incomingReplicat” : “RKFJSCON”,
“incomingHeartbeatTs” : “2021-08-27 13:17:14.149808000”,
“incomingExtractTs” : “2021-08-27 13:17:16.822345000”,
“incomingRoutingTs” : “2021-08-27 13:17:17.275030000”,
“incomingReplicatTs” : “2021-08-27 13:17:20.411229000”,
“outgoingReplicat” : “RKFJSCON”,
“outgoingReplicatTs” : “2021-08-27 13:17:20.412000000”
}


The every time a new heartbeat arrives the last heartbeat is written to a historical file by day up to the retention period where the data is then deleted:

{
“records” : [ {
“localDatabase” : “BigData”,
“heartbeatTimestamp” : “2021-08-27 00:00:14.110627000”,
“remoteDatabase” : “VBOXNCDB”,
“incomingExtract” : “E_HR_CL”,
“incomingRoutingPath” : “P_HR_CL”,
“incomingReplicat” : “RKFJSCON”,
“incomingHeartbeatTs” : “2021-08-27 00:00:14.110627000”,
“incomingExtractTs” : “2021-08-27 00:00:16.213547000”,
“incomingRoutingTs” : “2021-08-27 00:00:17.371348000”,
“incomingReplicatTs” : “2021-08-27 00:00:20.147079000”,
“outgoingReplicat” : “RKFJSCON”,
“outgoingReplicatTs” : “2021-08-27 00:00:20.170000000”
}, {
More json records
}, {
“localDatabase” : “BigData”,
“heartbeatTimestamp” : “2021-08-27 13:21:14.178962000”,
“remoteDatabase” : “VBOXNCDB”,
“incomingExtract” : “E_HR_CL”,
“incomingRoutingPath” : “P_HR_CL”,
“incomingReplicat” : “RKFJSCON”,
“incomingHeartbeatTs” : “2021-08-27 13:21:14.178962000”,
“incomingExtractTs” : “2021-08-27 13:21:16.602223000”,
“incomingRoutingTs” : “2021-08-27 13:21:17.675216000”,
“incomingReplicatTs” : “2021-08-27 13:21:21.481484000”,
“outgoingReplicat” : “RKFJSCON”,
“outgoingReplicatTs” : “2021-08-27 13:21:21.481000000”
} ]
}


So as you can see the heartbeat data is now in json format to be able to write alerts, OEM extensions or whatever else you see fit. Check out my next blog post on how to report on this data using a simple Python script!

Remember the Recyclebin

When poking around a system, make sure to look at the dba_recyclebin. Oftentimes, this functionality within Oracle seems to be overlooked and forgotten about. This is due to the fact that the default for the parameter “recyclebin” in Oracle 19c is “on”. You can also manage this parameter at the session level as well.

https://docs.oracle.com/en/database/oracle/oracle-database/19/refrn/RECYCLEBIN.html#GUID-B6F1AA5B-DF1E-4EAF-BDFD-E70EFBAD997A

Should a table drop occur by mistake, often the table can be recovered so long as the column “CAN_UNDROP” for that object shows the value “YES” in the dba_recyclebin table by issuing the command:

select owner, object_name, original_name, can_undrop from dba_recyclebin;
flashback table hr.emp to before drop;

It’s good functionality. Also the recyclebin helps in the case where your application must drop / create / recreate objects on a frequent basis because the operation is much faster as the drop command does not have to wait for the segments to drop.

The area that most forget about is “purging” the recyclebin. As a matter of fact, I recently saw a system the other day that had 5M objects in the recyclebin totaling several hundred GB of space most of which was several years old. Thats several hundred GB of space being backed up every day for objects which have been dropped!

Generally, purging the recyclebin is a manual operation. However, there is a way to implement a dbms_scheduler job which will do this on a regularly scheduled basis.

BEGIN
  DBMS_SCHEDULER.CREATE_JOB (
	job_name => 'WEEKLY_PURGE_RECYCLEBIN',
	job_type => 'PLSQL_BLOCK',
	job_action => 'DECLARE
		V_PRE_RECYCLEBIN_COUNT PLS_INTEGER := 0;
		V_PRE_RECYCLEBIN_SIZE NUMBER(38) :=0;
		V_POST_RECYCLEBIN_COUNT PLS_INTEGER := 0;
        V_SQL_STATEMENT VARCHAR2(500);
        V_DAYS_TO_PURGE PLS_INTEGER := 7;
        V_STALE_DICT_STATS PLS_INTEGER := 0;
        err_code NUMBER;
        err_msg VARCHAR2(500);
        CURSOR purge_bin_cursor IS select owner, object_name, original_name from dba_recyclebin where type=''TABLE'' and to_date(droptime,''YYYY-MM-DD:HH24:MI:SS'') < sysdate - V_DAYS_TO_PURGE;
		BEGIN
			select round(nvl(sum(space * 8192),0)/1024/1024,2) into V_PRE_RECYCLEBIN_SIZE from dba_recyclebin;
			select count(*) into V_PRE_RECYCLEBIN_COUNT from dba_recyclebin where to_date(droptime,''YYYY-MM-DD:HH24:MI:SS'')  0
			THEN
				DBMS_OUTPUT.PUT_LINE(''Purging ''||V_PRE_RECYCLEBIN_COUNT||'' objects, reclaiming ''||V_PRE_RECYCLEBIN_SIZE||'' MB from the recyclebin'');
				FOR purge_rec in purge_bin_cursor
				LOOP
                	V_SQL_STATEMENT := ''purge table ''||purge_rec.owner||''."''||purge_rec.object_name||''"'';
                	DBMS_OUTPUT.PUT_LINE(''Executing: ''||V_SQL_STATEMENT||'' for original object name ''||purge_rec.original_name);
					EXECUTE IMMEDIATE V_SQL_STATEMENT;
				END LOOP;
				select count(*) into V_POST_RECYCLEBIN_COUNT from dba_recyclebin;
				DBMS_OUTPUT.PUT_LINE(''Recyclebin has ''||V_POST_RECYCLEBIN_COUNT||'' objects remaining in the recyclebin'');
				select count(*) into V_STALE_DICT_STATS from dba_tab_statistics where owner = ''SYS'' AND TABLE_NAME = ''OBJ$'' and stale_stats = ''YES'';
				IF V_STALE_DICT_STATS = 1
				THEN
					DBMS_OUTPUT.PUT_LINE(''Executing Dictionary Statistics'');
					DBMS_STATS.GATHER_DICTIONARY_STATS;
				ELSE
					DBMS_OUTPUT.PUT_LINE(''Dictionary Statistics not stale'');
				END IF;
			ELSE
				DBMS_OUTPUT.PUT_LINE(''Nothing to purge from the recyclebin'');
			END IF;
		EXCEPTION
			WHEN OTHERS THEN
		    err_code := SQLCODE;
      		err_msg := SUBSTR(SQLERRM, 1, 500);
      		DBMS_OUTPUT.PUT_LINE(''An error was encountered - ''||SQLCODE||'' -ERROR- ''||SQLERRM);
		END;',
	start_date => sysdate,
	repeat_interval => 'FREQ=MONTHLY;BYDAY=1SAT;BYHOUR=18',
	end_date => NULL,
	enabled => TRUE,
	auto_drop => FALSE,
	comments => 'This job purges the recyclebin on the first Saturday of the Month at 18:00'
);
END;
/

As implemented above, this job will run once per week and delete everything that is older than 7 days that is in the recyclebin. No longer will you have to worry about the recyclebin and it containing too many un-purged objects!

Enjoy!

Oracle 12 Non-CDB to PDB Migration Methods

Continuing with trying to finish additional blog posts which have been on my list for a while, is a review of the methods of migrating a Non-Container Database (Non-CDB) to a Container Database (CDB) with Pluggables.

I wish this was easier and Oracle gave you a complete “in-place” method to do this, but the only way to get a Non-CDB (pre-12c database) to a CDB is to create a new database and migrate the Non-CDB into the new CDB as a PDB.

I will make the assumption that the creation of the new CDB is complete. So lets look at some methods of creating / migrating the PDB and their pros and cons:

In either case, you need to start with creating the XML file which will describe the new PDB:

On the Non-CDB:

	SHUTDOWN IMMEDIATE;
	startup mount exclusive;
	alter database open read only;

Create the PDB Describe XML File:

     BEGIN
       DBMS_PDB.DESCRIBE(
          pdb_descr_file => '/export/home/oracle/nonCDBToPDB.xml');
     END;
     /
     shutdown immediate;

Verify the XML File on the new CDB:

     SET SERVEROUTPUT ON
     DECLARE
         hold_var boolean;
     begin
          hold_var := DBMS_PDB.CHECK_PLUG_COMPATIBILITY(pdb_descr_file=>'/export/home/oracle/nonCDBToPDB.xml');
     if hold_var then
          dbms_output.put_line('YES');
     else
          dbms_output.put_line('NO');
     end if;
     end;
     /

Check for errors:

   set lines 300
   col cause for a25
   col message for a150
   set pagesize 9999
   select name,cause,action,type,message,status from PDB_PLUG_IN_VIOLATIONS;

Before you can proceed, all errors contained in PDB_PLUG_IN_VIOLATIONS must be resolved. Next are 2 out of the 3 methods to migrate an Non-CDB to PDB. I will leave the “COPY” method out of this post as it is not feasible to move any of the databases I deal with on a day to day basis using ‘COPY’.

Create the PDB using “NOCOPY”. While “NOCOPY” is the fastest, it could be the most problematic long term because this function leaves all datafiles where they came from and since the new CDB is likely to be on the same host, the naming differences could be confusing at some point. Nonetheless, for demonstration, the command is quite easy:

     CREATE PLUGGABLE DATABASE devpdb USING '/export/home/oracle/nonCDBToPDB.xml' NOCOPY TEMPFILE REUSE;

Based on my testing, the method I liked the most was the ‘MOVE’ option. To some, this may seem invasive, but for my environments this was the best option because the new file names are also corrected to contain the correct OMF path names based on the new CDB. While this method wasn’t as fast as NOCOPY, in my 18TB environment with 1200 datafiles, this command finished in just over 30 minutes. Pretty acceptable in my book:

     CREATE PLUGGABLE DATABASE devpdb USING '/export/home/oracle/nonCDBToPDB.xml' MOVE TEMPFILE REUSE;

Finishing off the migration to the new PDB is the same regardless of the migration method:

Verify the PDB:

	select name,guid, open_mode from v$pdbs;
	col pdb_name for a15
	select pdb_name, status from dba_pdbs;

Clean up the PDB. This by far was one of the longest operations of the whole conversion:

	alter session set container=devpdb;
	$ORACLE_HOME/rdbms/admin/noncdb_to_pdb.sql

Check for errors:

	set lines 300
	col cause for a25
	col message for a50
	col action for a100
	set pagesize 9999
	select name,cause,action,type,message,status from PDB_PLUG_IN_VIOLATIONS;

In my case, the only remaining violations that I had were some orphan database services that were stuck in the metadata. To clean this up you can execute:

	alter session set container=;
	
	select SERVICE_ID,NAME,NETWORK_NAME,PDB FROM CDB_SERVICES ORDER BY PDB,SERVICE_ID;
	select SERVICE_ID,NAME,NETWORK_NAME FROM DBA_SERVICES ORDER BY SERVICE_ID;
	
	exec dbms_service.delete_service('')

Ensure that all pluggables are open and open on restart:

	alter pluggable database all open;
	alter pluggable database all save state;

As with anything in our business, adequate testing goes a long way and these were my observations in my environment. If your experience varies, I sure would like to hear about it.

Adjusting Available CPU Threads in SuperCluster Local Zones Online

Lately, I have been working on the Oracle SuperCluster platform. After having worked with Linux for the past many years, it was quite refreshing to get back to an OS that so many of us have worked on. As part of our local zone layout, we have a requirement to allocate different amount of M7 CPU Threads per zone. Upon researching the best way to do this, I found varying information, so I thought that I would go ahead and blog about the way that worked best for this situation.

In this case, CPU Thread control was set-up using resource pools. Solaris Resource Pools are described here:

Oracle Solaris Resource Pools

By default, the resource pool does not restrict access or control scheduling. By modifying the resource pool and allocating specific threads to specific zones, you thereby allocate threads to the local zones.

Here’s how:

First, lets display the pool layout. Since we only need to look at allocating threads (the command actually outputs a ton of data), I will limit the output to only what is relevant.

Find the pool configurations you want to effect. Pset pertains directly to cpu threads so that is what we will look for:

#  poolcfg -dc info | egrep 'pset |pset.size|pset.min|pset.max'

        pset pset_[host name]_id_25289
                uint    pset.min 32
                uint    pset.max 32
                uint    pset.size 32
        pset pset_[host name]_id_25223
                uint    pset.min 64
                uint    pset.max 64
                uint    pset.size 64
        pset pset_[host name]_id_25287
                uint    pset.min 64
                uint    pset.max 64
                uint    pset.size 64
        pset pset_[host name]_id_25224
                uint    pset.min 32
                uint    pset.max 32
                uint    pset.size 32
        pset pset_default
                uint    pset.min 1
                uint    pset.max 65536
                uint    pset.size 64

In this case we can see that out of the 256 CPU threads available to this Global Domain, 32 have been allocated to the first local domain, 64 each to the next 2 and then 32 to the last, leaving 64 in the default pool or available to the global domain.

If you would like to see the file which also details the complete rules of the resource pool, you can look here:

/etc/pooladm.conf

To start with any modifications, it is best to ensure that the latest configuration is saved. To do so you can run this command from the global domain:

# pooladm -s

Once this has been done, you can proceed with the reallocation. In this example, I will modify one pool by taking CPU Threads from the default pool.
Using “-d” operates directly on the kernel state, so use this with caution. On a running system, I would reallocate in small chunks. That will give the operating system time to adapt to the different CPU configuration. In this example we will add 8 threads to a local zone which already had 32 Threads:

# poolcfg -dc 'modify pset pset_[host name]_id_25289 ( uint pset.min = 40 ; uint pset.max = 40)'

At this point the change has been made to the configuration file only (/etc/pooladm.conf), not actually to the system. To make the change to the system, save the configuration and commit to the system:

# pooladm -s

# pooladm -c

Once this change is done, we can inspect the configuration by running the same command shown above. Notice the changes below:

#  poolcfg -dc info | egrep 'pset |pset.size|pset.min|pset.max'

        pset pset_[host name]_id_25289
                uint    pset.min 40
                uint    pset.max 40
                uint    pset.size 40
        pset pset_[host name]_id_25223
                uint    pset.min 64
                uint    pset.max 64
                uint    pset.size 64
        pset pset_[host name]_id_25287
                uint    pset.min 64
                uint    pset.max 64
                uint    pset.size 64
        pset pset_[host name]_id_25224
                uint    pset.min 32
                uint    pset.max 32
                uint    pset.size 32
        pset pset_default
                uint    pset.min 1
                uint    pset.max 65536
                uint    pset.size 56

If you need to transfer cpu from one local zone to another, you can do so by executing the following command:

poolcfg -dc 'transfer 8 from pset pset_default to pset_[host name]_id_25289'

Or if you want to assign a specific CPU Thread:

poolcfg -dc 'transfer to pset pset_[host name]_id_25289 ( cpu 5)'

The rest of the steps remain the same. In the next post I will show you how to verify the additional CPU in each local zone.

Improper Use of the Oracle ‘Rownum’ Pseudocolumn

The other day I found myself needing to explain to some developers why their use-case of the Oracle ‘rownum’ pseudocolumn was yielding a result in one database instance, but a completely different result in another.

In this situation, the correct result is the ‘maximum’ value of the column, however this query was also occasionally returning the exact ‘minimum’ value of this column. How could this happen? The answer lies in the using the ‘rownum’ pseudocolumn correctly. Of course there are other (probably better) ways to write this query without the use of ‘rownum’, but I’m not here to debate that right now….

** Note the tables in the query have been changed to protect the innocent.

select column_a from (select column_a,rownum rowid0 from schema.table order by column_a desc ) aa where aa.rowid0 =1;

Oracle documentation states that it depends how Oracle accessed the rows in the query as to which result you will get. For example your results can vary depending on a lot of factors (ie: the order that you inserted the data in the table or if there is an index on the table and how that index is used). For further information you can see the documentation here:

https://docs.oracle.com/cd/B28359_01/server.111/b28286/pseudocolumns009.htm#SQLRF00255

For further explanation, lets explore the explain plans encountered used in each system:

Correct Result:


--------------------------------------------------------------------------------------------------------------
| Id  | Operation                    | Name                          | Rows  | Bytes | Cost (%CPU)| Time     |
--------------------------------------------------------------------------------------------------------------
|   0 | SELECT STATEMENT             |                               |       |       |     1 (100)|          |
|*  1 |  VIEW                        |                               |  1257 | 32682 |     1   (0)| 00:00:01 |
|   2 |   COUNT                      |                               |       |       |            |          |
|   3 |    INDEX FULL SCAN DESCENDING| SCHEMA_TABLE_PK               |  1257 |  6285 |     1   (0)| 00:00:01 |
--------------------------------------------------------------------------------------------------------------

Predicate Information (identified by operation id):
---------------------------------------------------

   1 - filter("AA"."ROWID0"=1)


22 rows selected.

Incorrect Result:


---------------------------------------------------------------------------------------------------------
| Id  | Operation               | Name                          | Rows  | Bytes | Cost (%CPU)| Time     |
---------------------------------------------------------------------------------------------------------
|   0 | SELECT STATEMENT        |                               |       |       |     4 (100)|          |
|*  1 |  VIEW                   |                               |  1257 | 32682 |     4  (25)| 00:00:01 |
|   2 |   SORT ORDER BY         |                               |  1257 |  6285 |     4  (25)| 00:00:01 |
|   3 |    COUNT                |                               |       |       |            |          |
|   4 |     INDEX FAST FULL SCAN| SCHEMA_TABLE_PK               |  1257 |  6285 |     3   (0)| 00:00:01 |
---------------------------------------------------------------------------------------------------------

Predicate Information (identified by operation id):
---------------------------------------------------

   1 - filter("AA"."ROWID0"=1)


24 rows selected.

As you can see, the major difference here is that the two systems have not chosen the same access path in which to return the data. In one system a plan utilized an ‘INDEX FULL SCAN DESCENDING’ access path, while the other utilized an ‘INDEX FAST FULL SCAN’ access path.

Is this really that different? Turns out it is.

ASK Tom Explained the reason why very concisely:
(Ask TOM “Difference between Full Index Scans and Fast Full Index Scans”)

They state that:

“An index fast full scan reads the ENTIRE index, unsorted, as it exists on disk. It is basically using the index as a “skinny” version of the table. The query in question would only be accessing attributes in the index (we are not using the index as a way to get to the table, we are using the index INSTEAD of the table) We use multiblock IO and read all of the leaf, branch and the root block. We ignore the branch and root blocks and just process the (unordered) data on the leaf blocks.

An index full scan is when we read the index a block at a time – from start to finish. We’ll read the root block, navigate down the left hand side of the index (or right if we are doing a descending full scan) and then when we hit the leaf block – we’ll read across the entire bottom of the index – a block at a time – in sorted order. We use single block IO, not multiblock IO for this operation.”

Well there you have it. And this is why the result is different. How can we keep this from occurring in the future? The answer is to utilize the ‘rownum’ pseudocolumn correctly. Remember, rownum is not a real column so in order to get the right results, it needs to be added after the data is in the sorted order that you want. To do that, make sure you write the query so that ‘rownum’ is applied after the sort. Using the same query above, lets ‘rewrite’ it in such a way that it will achieve the desired results:

select column_a from (select column_a,rownum from (select column_a from schema.table order by column_a desc)) where rownum = 1;

See the steps now?

  1. Retrieve data in sorted order
  2. Apply the ‘rownum’ pseudocolumn
  3. Filter for the desired value in the list

If you must use the ‘rownum’ pseudocolumn, writing your query in this manner will ensure that you always get the same result.

Enjoy!

Oracle Native Network Encryption

With all of the security concerns out there and data being more important than ever, it might be also time to consider encrypting your data connections, even within your own data center. If you are utilizing cloud, there should be no question that some sort of encryption should be used. In terms of what Oracle provides, you have two options, Native Encryption and SSL/TLS encryption. As of the time of this writing, both of these options are free to use and are no longer part of the Advanced Security Option. In this post, I will discuss the set-up and use of Native Encryption, with SSL/TLS to come later.

Native network encryption provided by the Oracle client is by far, the easiest to set up, so in that same context it would also be the easiest to bypass. That said, there are ways to set it up in such a way that those risks can be mitigated. Due to those same risks, Native encryption would be a great solution to use within a private data center, but not in a public or hybrid cloud scenario. SSL/TLS would be an option to pursue in a public or hybrid cloud scenario and I plan to discuss that in a future post.

Set Up:

Setup of Native encryption is pretty straight forward and easy, especially for OCI “Thick” connections and any other method that utilizes the sqlnet.ora file. In cases where that file is not utilized, there is some additional setup and I will discuss that as well.

First, it is important to understand all of the different combinations of parameters which Native encryption uses. Luckily it is only two, however, there are many different combinations and those combinations and their results are better detailed here:

Version 12.x (OCI Thick):
https://docs.oracle.com/database/121/DBSEG/asoconfg.htm#DBSEG020

Version 12.x (JDBC Thin):
https://docs.oracle.com/database/121/DBSEG/asojbdc.htm#DBSEG9609

By default, both sides of any client connection is configured to ‘ACCEPT’ an encrypted connection.  Because of this, you only have to configure one side or the other, but for safety reasons, I would recommend configuration of both sides.

In 11.2, there are a few less options in terms of encryption and checksum algorithms, so for simplicity circumstances, I will just illustrate a 12.x ‘THICK’ client connection to an 11.2.0.4 database.

To enable this option within the ‘THICK’ client:

# sqlnet.ora Network Configuration File: /u01/app/oracle/product/12.2.0/client_1/network/admin/sqlnet.ora
# Generated by Oracle configuration tools.

NAMES.DIRECTORY_PATH= (TNSNAMES, EZCONNECT)

SQLNET.ENCRYPTION_CLIENT = REQUIRED
SQLNET.ENCRYPTION_TYPES_CLIENT = (AES256)

SQLNET.CRYPTO_CHECKSUM_CLIENT = REQUIRED
SQLNET.CRYPTO_CHECKSUM_TYPES_CLIENT = (SHA1)

If you are utilizing JDBC ‘thin’ connections, then you can also set the properties within the java code itself:

prop.setProperty(OracleConnection.CONNECTION_PROPERTY_THIN_NET_ENCRYPTION_LEVEL,level);
prop.setProperty(OracleConnection.CONNECTION_PROPERTY_THIN_NET_ENCRYPTION_TYPES,algorithm);
prop.setProperty(OracleConnection.CONNECTION_PROPERTY_THIN_NET_CHECKSUM_LEVEL,level);
prop.setProperty(OracleConnection.CONNECTION_PROPERTY_THIN_NET_CHECKSUM_TYPES, algorithm);

And edit the sqlnet.ora on the server:

# sqlnet.ora Network Configuration File: /u01/app/11.2.0.4/grid/network/admin/sqlnet.ora
# Generated by Oracle configuration tools.

NAMES.DIRECTORY_PATH= (TNSNAMES, EZCONNECT)

ADR_BASE = /u01/app/oracle

SQLNET.ENCRYPTION_SERVER = REQUIRED
SQLNET.ENCRYPTION_TYPES_SERVER = (AES256)

SQLNET.CRYPTO_CHECKSUM_SERVER = REQUIRED
SQLNET.CRYPTO_CHECKSUM_TYPES_SERVER = (SHA1)

Validation:

There are a few ways to validate that encryption is actually taking place. The easiest is to execute the following SQL upon login to the database:

If no encryption is occurring, then the banner will look like this:

SQL> select network_service_banner from v$session_connect_info
  2  where sid in (select distinct sid from v$mystat);

NETWORK_SERVICE_BANNER
-----------------------
TCP/IP NT Protocol Adapter for Linux: Version 11.2.0.4.0 - Production
Oracle Advanced Security: encryption service for Linux: Version 11.2.0.4.0 - Production
Oracle Advanced Security: crypto-checksumming service for Linux: Version 11.2.0.4.0 - Production

If encryption is happening, then the banner will return additional data:

SQL> select network_service_banner from v$session_connect_info
  2  where sid in (select distinct sid from v$mystat);

NETWORK_SERVICE_BANNER
-----------------------
TCP/IP NT Protocol Adapter for Linux: Version 11.2.0.4.0 - Production
Oracle Advanced Security: encryption service for Linux: Version 11.2.0.4.0 - Production
Oracle Advanced Security: AES256 encryption service adapter for Linux: Version 11.2.0.4.0 - Product
Oracle Advanced Security: crypto-checksumming service for Linux: Version 11.2.0.4.0 - Production
Oracle Advanced Security: SHA1 crypto-checksumming service adapter

Notice the 2 additional lines in the banner when encryption is occurring:
Oracle Advanced Security: AES256 encryption service adapter for Linux: Version 11.2.0.4.0 – Product
Oracle Advanced Security: SHA1 crypto-checksumming service adapter

So the database indicates that encryption is happening, so what is actually happening on the wire? To determine that, we can either use a product like Wireshark or trace the connection to the listener. To do this, enable the following parameters in the SQLNET.ORA on the client:

DIAG_ADR_ENABLED=OFF
TRACE_DIRECTORY_CLIENT=/home/oracle/trace
TRACE_FILE_CLIENT=nettrace
TRACE_LEVEL_CLIENT=16

And in the trace filem you will see an entry similar to the following:

(3310995200) [24-APR-2017 10:19:21:077] na_tns:         Encryption is active, using AES256
(3310995200) [24-APR-2017 10:19:21:077] na_tns:         Crypto-checksumming is active, using SHA1

So as you can see, the setup of Native encryption is quite easy. As with any additional feature, performance could be compromised, so make sure you test all combinations thoroughly in order to determine what works best in your environment. Enjoy!