I previously blogged about ensuring that the “ON CONFLICT” directive is used in order to avoid vacuum from having to do additional work. I also later demonstrated the characteristics of how the use of the MERGE statement will accomplish the same thing.
Now in another recent customer case, I was chasing down why the application was invoking 10s of thousands of Foreign Key and Constraint violations per day and I began to wonder, if these kinds of errors also caused additional vacuum as described in those previous blogs. Sure enough it DEPENDS.
Let’s set up a quick test to demonstrate:
/* Create related tables: */
CREATE TABLE public.uuid_product_value (
        id int PRIMARY KEY,
        pkid text,
        value numeric,
        product_id int,
        effective_date timestamp(3)
        );

CREATE TABLE public.uuid_product (
        product_id int PRIMARY KEY
        );

ALTER TABLE uuid_product_value
    ADD CONSTRAINT uuid_product_value_product_id_fk
    FOREIGN KEY (product_id)
    REFERENCES uuid_product (product_id) ON DELETE CASCADE;

/* Insert some mocked up data */
INSERT INTO public.uuid_product VALUES (
        generate_series(0,200));

INSERT INTO public.uuid_product_value VALUES (
        generate_series(0,10000),
        gen_random_uuid()::text,
        random()*1000,
        ROUND(random()*100),
        current_timestamp(3));

/* Vacuum Analyze Both tables */
VACUUM (VERBOSE, ANALYZE) uuid_product;
VACUUM (VERBOSE, ANALYZE) uuid_product_value;

/* Verify that there are no dead tuples: */
SELECT
    schemaname,
    relname,
    n_live_tup,
    n_dead_tup
FROM
    pg_stat_all_tables
WHERE
    relname in ('uuid_product_value', 'uuid_product');

 schemaname |      relname       | n_live_tup | n_dead_tup
------------+--------------------+------------+------------
 public     | uuid_product_value |      10001 |          0
 public     | uuid_product       |        201 |          0
Then, let’s issue a simple insert that will violate the FK and check to see if dead tuples were generated:
/* Insert a row that violates the FK, without the ON CONFLICT directive */
INSERT INTO public.uuid_product_value VALUES (
        generate_series(10001,10001),
        gen_random_uuid()::text,
        random()*1000,
        202,  /* we know this product_id doesn't exist in the parent */
        current_timestamp(3));

ERROR:  insert or update on table "uuid_product_value" violates foreign key constraint "uuid_mod_test_product_id_fk"
DETAIL:  Key (product_id)=(202) is not present in table "uuid_product".
Time: 3.065 ms
And now check the tuple stats:
SELECT
    schemaname,
    relname,
    n_live_tup,
    n_dead_tup
FROM
    pg_stat_all_tables
WHERE
    relname in ('uuid_product_value', 'uuid_product');

 schemaname |      relname       | n_live_tup | n_dead_tup
------------+--------------------+------------+------------
 public     | uuid_product_value |      10001 |          1
 public     | uuid_product       |        201 |          0
Sure enough, we now have a dead row as a result of the FK violation on the insert. But, will an “ON CONFLICT” directive help us in this scenario like in the others?
/* Insert a row that violates the FK, but with the ON CONFLICT directive */
INSERT INTO public.uuid_product_value VALUES (
        generate_series(10001,10001),
        gen_random_uuid()::text,
        random()*1000,
        202,  /* we know this product_id doesn't exist in the parent */
        current_timestamp(3)) ON CONFLICT DO NOTHING;

/* Verify the tuple stats: */
SELECT
    schemaname,
    relname,
    n_live_tup,
    n_dead_tup
FROM
    pg_stat_all_tables
WHERE
    relname in ('uuid_product_value', 'uuid_product');

 schemaname |      relname       | n_live_tup | n_dead_tup
------------+--------------------+------------+------------
 public     | uuid_product_value |      10001 |          2
 public     | uuid_product       |        201 |          0
Unfortunately, it does not solve this problem. So we need to really be cognizant of FK violations and its effect on vacuum. Now what about trying to insert a NULL into a NOT NULL column? Will that result in a dead row? Let’s check.
/* Alter a column to NOT NULL */
ALTER TABLE public.uuid_product_value
    ALTER COLUMN pkid SET NOT NULL;

/* Check the table definition */
                        Table "public.uuid_product_value"
     Column     |              Type              | Collation | Nullable | Default
----------------+--------------------------------+-----------+----------+---------
 id             | integer                        |           | not null |
 pkid           | text                           |           | not null |
 value          | numeric                        |           |          |
 product_id     | integer                        |           |          |
 effective_date | timestamp(3) without time zone |           |          |
Indexes:
    "uuid_mod_test_pkey" PRIMARY KEY, btree (id)
    "uuid_mod_test_product_id_idx" btree (product_id) WHERE id >= 1 AND id <= 1000
    "uuid_mod_test_product_id_idx1" hash (product_id)
Foreign-key constraints:
    "uuid_mod_test_product_id_fk" FOREIGN KEY (product_id) REFERENCES uuid_product(product_id) ON DELETE CASCADE

/* Insert a row that violates the NOT NULL constraint */
INSERT INTO public.uuid_product_value VALUES (
        generate_series(10001,10001),
        NULL,
        random()*1000,
        200,
        current_timestamp(3));
ERROR:  null value in column "pkid" of relation "uuid_product_value" violates not-null constraint
DETAIL:  Failing row contains (10001, null, 613.162063338205, 200, 2026-03-13 14:25:28.758).

/* Verify the tuple stats: */
SELECT
    schemaname,
    relname,
    n_live_tup,
    n_dead_tup
FROM
    pg_stat_all_tables
WHERE
    relname in ('uuid_product_value', 'uuid_product');

 schemaname |      relname       | n_live_tup | n_dead_tup
------------+--------------------+------------+------------
 public     | uuid_product_value |      10001 |          2
 public     | uuid_product       |        201 |          0
As you can see, a violation of the NOT NULL constraint does not have the same behavior as a violation of the FK constraint. It’s always good to know and relay to the application development staff what operations are going to result in more work for the database and adjust the code accordingly. Enjoy!
The short answer is always “maybe”. However, in the following post, I hope to demonstrate what creates a sub-transactions and what happens to the overall transaction id utilization when they are invoked. I will also show how performance is affected when there are lots of connections creating and consuming sub-transactions.
First, it is important to understand what statements will utilize a transaction id and which ones may be more critical (expensive) than others:
Calling Nested Procedures: 🟢 Free. No new XIDs are used. They share the parent’s transaction.
BEGIN…END (No Exception Block): 🟢 Free. Just organization.
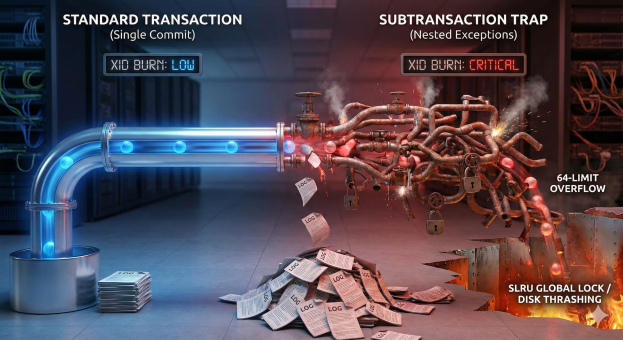
COMMIT: 🟡 Expensive. Burns a main Transaction ID (finite resource, leads to Vacuum Freeze).
EXCEPTION: 🔴 Dangerous. Creates a subtransaction (performance killer).
So why is misplaced EXCEPTION logic possibly a performance killer? PostgreSQL is optimized to handle a small number of open subtransactions very efficiently. Each backend process has a fixed-size array in shared memory (part of the PGPROC structure) that can hold up to 64 open subtransaction IDs (XIDs) for the current top-level transaction. As long as your nesting depth stays below 64, PostgreSQL manages everything in this fast, local memory array. It does not need to use the Subtrans SLRU (Simple Least Recently Used) subsystem, which is what pg_stat_slru tracks. The problem is that the utilization of subtransaction IDs (XIDs) can get out of hand rather quickly if you are not paying attention to your application flow and once PostgreSQL runs out of fast RAM slots (PGPROC array) and spills tracking data to the slow SLRU cache (pg_subtrans), performance degrades non-linearly (often 50x–100x slower) and causes global locking contention that can freeze other users.
One of the other byproducts of utilizing too many sub-transactions is the additional WAL that will be generated. All of these can be demonstrated by a simple block of code:
------------------------------------------------------------------
-- 1. PREP: Create the helper function
------------------------------------------------------------------
CREATE OR REPLACE FUNCTION generate_subtrans_load(p_id int, depth int)
RETURNS void AS $$
BEGIN
    IF depth > 0 THEN
        BEGIN
            PERFORM generate_subtrans_load(p_id, depth - 1);
        EXCEPTION WHEN OTHERS THEN NULL;
        END;
    ELSE
        INSERT INTO penalty_test VALUES (p_id, 'Deep Stack');
    END IF;
END;
$$ LANGUAGE plpgsql;

------------------------------------------------------------------
-- 2. THE COMPLETE TEST SUITE
------------------------------------------------------------------
DO $$
DECLARE
    -- Timing Variables
    v_start_ts  timestamp;
    v_t_base    interval; v_t_single interval;
    v_t_48      interval; v_t_128    interval;

    -- Row Verification
    v_rows_base int;      v_rows_single int;
    v_rows_48   int;      v_rows_128    int;

    -- WAL Variables
    v_start_lsn pg_lsn;   v_end_lsn  pg_lsn;
    v_wal_base  numeric;  v_wal_single numeric;
    v_wal_48    numeric;  v_wal_128    numeric;

    -- XID Variables
    v_start_xid xid8;     v_end_xid  xid8;
    v_xid_base  bigint;   v_xid_single bigint;
    v_xid_48    bigint;   v_xid_128    bigint;

    i int;
    v_target_rows int := 5000;

    -- Helper calc vars
    v_us_48 numeric;
    v_us_128 numeric;
BEGIN
    ---------------------------------------------------
    -- A. SETUP
    ---------------------------------------------------
    DROP TABLE IF EXISTS penalty_test;
    -- Explicitly preserve rows so COMMIT doesn't empty the table
    CREATE TEMP TABLE penalty_test (id int, val text) ON COMMIT PRESERVE ROWS;

    ---------------------------------------------------
    -- B. TEST 1: BASELINE (Standard Loop)
    ---------------------------------------------------
    -- 1. Force fresh start
    COMMIT;
    v_start_ts  := clock_timestamp();
    v_start_lsn := pg_current_wal_insert_lsn();
    v_start_xid := pg_snapshot_xmax(pg_current_snapshot());

    FOR i IN 1..v_target_rows LOOP
        INSERT INTO penalty_test VALUES (i, 'Standard');
    END LOOP;

    -- 2. Force snapshot refresh to see XID consumption
    COMMIT;
    v_end_lsn := pg_current_wal_insert_lsn();
    v_end_xid := pg_snapshot_xmax(pg_current_snapshot());
    v_t_base  := clock_timestamp() - v_start_ts;

    SELECT count(*) INTO v_rows_base FROM penalty_test;
    v_wal_base := v_end_lsn - v_start_lsn;
    v_xid_base := (v_end_xid::text::bigint - v_start_xid::text::bigint);

    ---------------------------------------------------
    -- C. TEST 2: SINGLE TRAP (Depth 1)
    ---------------------------------------------------
    TRUNCATE TABLE penalty_test;
    COMMIT; -- Clear stats

    v_start_ts  := clock_timestamp();
    v_start_lsn := pg_current_wal_insert_lsn();
    v_start_xid := pg_snapshot_xmax(pg_current_snapshot());

    FOR i IN 1..v_target_rows LOOP
        BEGIN
            INSERT INTO penalty_test VALUES (i, 'Single Trap');
        EXCEPTION WHEN OTHERS THEN NULL;
        END;
    END LOOP;

    COMMIT; -- Force refresh
    v_end_lsn := pg_current_wal_insert_lsn();
    v_end_xid := pg_snapshot_xmax(pg_current_snapshot());
    v_t_single := clock_timestamp() - v_start_ts;

    SELECT count(*) INTO v_rows_single FROM penalty_test;
    v_wal_single := v_end_lsn - v_start_lsn;
    v_xid_single := (v_end_xid::text::bigint - v_start_xid::text::bigint);

    ---------------------------------------------------
    -- D. TEST 3: SAFE ZONE (Depth 48)
    ---------------------------------------------------
    TRUNCATE TABLE penalty_test;
    COMMIT;

    v_start_ts  := clock_timestamp();
    v_start_lsn := pg_current_wal_insert_lsn();
    v_start_xid := pg_snapshot_xmax(pg_current_snapshot());

    FOR i IN 1..v_target_rows LOOP
        PERFORM generate_subtrans_load(i, 48);
    END LOOP;

    COMMIT;
    v_end_lsn := pg_current_wal_insert_lsn();
    v_end_xid := pg_snapshot_xmax(pg_current_snapshot());
    v_t_48    := clock_timestamp() - v_start_ts;

    SELECT count(*) INTO v_rows_48 FROM penalty_test;
    v_wal_48 := v_end_lsn - v_start_lsn;
    v_xid_48 := (v_end_xid::text::bigint - v_start_xid::text::bigint);

    ---------------------------------------------------
    -- E. TEST 4: OVERFLOW ZONE (Depth 128)
    ---------------------------------------------------
    TRUNCATE TABLE penalty_test;
    COMMIT;

    v_start_ts  := clock_timestamp();
    v_start_lsn := pg_current_wal_insert_lsn();
    v_start_xid := pg_snapshot_xmax(pg_current_snapshot());

    FOR i IN 1..v_target_rows LOOP
        PERFORM generate_subtrans_load(i, 128);
    END LOOP;

    COMMIT;
    v_end_lsn := pg_current_wal_insert_lsn();
    v_end_xid := pg_snapshot_xmax(pg_current_snapshot());
    v_t_128   := clock_timestamp() - v_start_ts;

    SELECT count(*) INTO v_rows_128 FROM penalty_test;
    v_wal_128 := v_end_lsn - v_start_lsn;
    v_xid_128 := (v_end_xid::text::bigint - v_start_xid::text::bigint);

    ---------------------------------------------------
    -- F. THE REPORT
    ---------------------------------------------------
    RAISE NOTICE '===================================================';
    RAISE NOTICE '    POSTGRESQL SUBTRANSACTION IMPACT REPORT      ';
    RAISE NOTICE '===================================================';
    RAISE NOTICE 'Target Rows: %', v_target_rows;
    RAISE NOTICE '---------------------------------------------------';

    RAISE NOTICE 'METRIC 1: EXECUTION TIME & VERIFICATION';
    RAISE NOTICE '  1. Baseline:         % (Rows: %)', v_t_base, v_rows_base;
    RAISE NOTICE '  2. Single Exception: % (Rows: %)', v_t_single, v_rows_single;
    RAISE NOTICE '  3. Safe Zone (48):   % (Rows: %)', v_t_48, v_rows_48;
    RAISE NOTICE '  4. Overflow (128):   % (Rows: %)', v_t_128, v_rows_128;
    RAISE NOTICE '---------------------------------------------------';

    v_us_48  := extract(epoch from v_t_48) * 1000000;
    v_us_128 := extract(epoch from v_t_128) * 1000000;

    RAISE NOTICE 'METRIC 2: AVERAGE COST PER SUBTRANSACTION';
    RAISE NOTICE '   - Safe Zone (48):     % us per subtrans', round(v_us_48 / (v_target_rows * 48), 2);
    RAISE NOTICE '   - Overflow Zone (128): % us per subtrans', round(v_us_128 / (v_target_rows * 128), 2);

    IF (v_us_128 / (v_target_rows * 128)) > (v_us_48 / (v_target_rows * 48)) THEN
        RAISE NOTICE '   -> RESULT: Overflow subtransactions were % %% slower per unit.',
            round( ( ((v_us_128 / (v_target_rows * 128)) - (v_us_48 / (v_target_rows * 48))) / (v_us_48 / (v_target_rows * 48)) * 100)::numeric, 1);
    ELSE
         RAISE NOTICE '   -> RESULT: Overhead appears linear.';
    END IF;
    RAISE NOTICE '---------------------------------------------------';

    RAISE NOTICE 'METRIC 3: DISK USAGE (WAL WRITTEN)';
    RAISE NOTICE '  1. Baseline:         % bytes', v_wal_base;
    RAISE NOTICE '  2. Single Exception: % bytes', v_wal_single;
    RAISE NOTICE '  3. Safe Zone (48):   % bytes', v_wal_48;
    RAISE NOTICE '  4. Overflow (128):   % bytes', v_wal_128;
    RAISE NOTICE '---------------------------------------------------';

    RAISE NOTICE 'METRIC 4: TRANSACTION ID CONSUMPTION';
    RAISE NOTICE '  1. Baseline:         % XIDs', v_xid_base;
    RAISE NOTICE '  2. Single Exception: % XIDs', v_xid_single;
    RAISE NOTICE '  3. Safe Zone (48):   % XIDs', v_xid_48;
    RAISE NOTICE '  4. Overflow (128):   % XIDs', v_xid_128;

    RAISE NOTICE '===================================================';
END $$;
The code block above shows 4 different scenarios:
Baseline: Simple insert that inserts a number of rows in a loop with no exception logic
Single Exception (Depth 1): The same insert loop but with an exception block that fires after every insert
48 Sub-transaction Loop (Depth 48): A function call that arbitrarily creates 48 subtransactions (well below the 64 limit) and then completes the same insert
128 Sub-transaction Loop (Depth 128): A function call that arbitrarily creates 128 subtransactions (well above the 64 limit) and then completes the same insert
What you will see is that when run by a single user the impact is not terribly great. Besides utilizing more transaction ids (XIDs) and generating much wal, the system and performance impact of this does not appear to be a big deal. When running for a 5000 row insert:
NOTICE:  ===================================================
NOTICE:      POSTGRESQL SUBTRANSACTION IMPACT REPORT
NOTICE:  ===================================================
NOTICE:  Target Rows: 5000
NOTICE:  ---------------------------------------------------
NOTICE:  METRIC 1: EXECUTION TIME & VERIFICATION
NOTICE:    1. Baseline:         00:00:00.020292 (Rows: 5000)
NOTICE:    2. Single Exception: 00:00:00.033419 (Rows: 5000)
NOTICE:    3. Safe Zone (48):   00:00:01.414132 (Rows: 5000)
NOTICE:    4. Overflow (128):   00:00:03.817267 (Rows: 5000)
NOTICE:  ---------------------------------------------------
NOTICE:  METRIC 2: AVERAGE COST PER SUBTRANSACTION
NOTICE:     - Safe Zone (48):     5.89 us per subtrans
NOTICE:     - Overflow Zone (128): 5.96 us per subtrans
NOTICE:     -> RESULT: Overflow subtransactions were 1.2 % slower per unit.
NOTICE:  ---------------------------------------------------
NOTICE:  METRIC 3: DISK USAGE (WAL WRITTEN)
NOTICE:    1. Baseline:         48 bytes
NOTICE:    2. Single Exception: 43936 bytes
NOTICE:    3. Safe Zone (48):   2076216 bytes
NOTICE:    4. Overflow (128):   5536832 bytes
NOTICE:  ---------------------------------------------------
NOTICE:  METRIC 4: TRANSACTION ID CONSUMPTION
NOTICE:    1. Baseline:         1 XIDs
NOTICE:    2. Single Exception: 5001 XIDs
NOTICE:    3. Safe Zone (48):   240001 XIDs
NOTICE:    4. Overflow (128):   640002 XIDs
NOTICE:  ===================================================
DO
Time: 5294.689 ms (00:05.295)
As you can see in the results above, due to the transaction tracking, each scenario burns more XIDs and creates more WAL. This is due to the additional transaction tracking that must be available should the WAL need to be replayed. Where the real killer comes in is when multiple connections all begin to execute this same code. When I did a synthetic test using Apache JMeter the results are astounding. The test was completed on a 4vCPU C4A AlloyDB Instance:
Test
Average Time Per Exec
Min Exec Time
Max EXEC Time
1 User x 50 iterations
2137ms
2069ms
3477ms
4 Users x 50 iterations
3171ms
2376ms
4080ms
10 Users x 50 iterations
9041ms
4018ms
47880ms
As more users are added, the time is increased due to the time needed to manage the XID space and write the additional WAL. Some of this is increased time is due to the elongated connection time due to the XID space. When the same test was executed with a Managed Connection Pooler, times came down a little bit:
Test
Average Time Per Exec
Min Exec Time
Max EXEC Time
10 Users x 50 iterations
6399ms
2690ms
10624ms
Now you ask, how can I monitor for this performance impact? The verdict is that it depends. Wide variations in execution time depending on database load may be one indication. Another indication may be entries in the pg_stat_slru table (however depending on the available ram, metrics may not appear here) and a final indication will always be WAL usage. In summary:
Metric
What it tells you
What it hides
Execution Time
“My query is slow.”
It doesn’t explain why (CPU vs Lock vs I/O). Additional investigation may be required.
pg_stat_slru
“Disk is thrashing.”
It reads 0 if you have enough RAM, hiding the fact that your CPU is burning up managing memory locks.
WAL Volume
The Real Truth.
It proves you are writing massive amounts of metadata (savepoint markers) to disk, even if the data volume is small.
When considering the three scenarios:
Tier 1: Standard Loop (Baseline)
Mechanism: One single transaction for the whole batch.
Overhead: Near zero.
Verdict: 🟢 Safe. This is how Postgres is designed to work.
Tier 2: The “Safety Trap” (Exception Block)
Mechanism: Uses BEGIN…EXCEPTION inside the loop.
Hidden Cost: Every single iteration creates a Subtransaction. This burns a Subtransaction ID and forces a WAL write to create a “savepoint” it can roll back to.
Verdict: 🟡 Risky. It is 3x–5x slower and generates massive Write-Ahead Log (WAL) bloat, even for successful inserts.
Tier 3: The “Overflow” Disaster (Depth > 64)
Mechanism: Nesting subtransactions deeper than 64 layers (or having >64 active savepoints).
The Cliff: PostgreSQL runs out of fast RAM slots (PGPROC array) and must spill tracking data to the slow SLRU cache (pg_subtrans).
Verdict: 🔴 Catastrophic. Performance degrades non-linearly (often 50x–100x slower) and causes global locking contention that can freeze other users.
Final Recommendation: If you need to handle errors in a bulk load (e.g., “Insert 10,000 rows, skip the ones that fail”):
DO validate data before the insert to filter out bad rows in the application layer or a staging table
Do NOT wrap every insert in an EXCEPTION block. i.e a LOOP
Use EXCEPTION logic purposefully and avoid the need for CATCH ALL like “WHEN OTHERS”
DO use INSERT … ON CONFLICT DO NOTHING (if the error is unique constraint)